Fig. 4.
Download original image
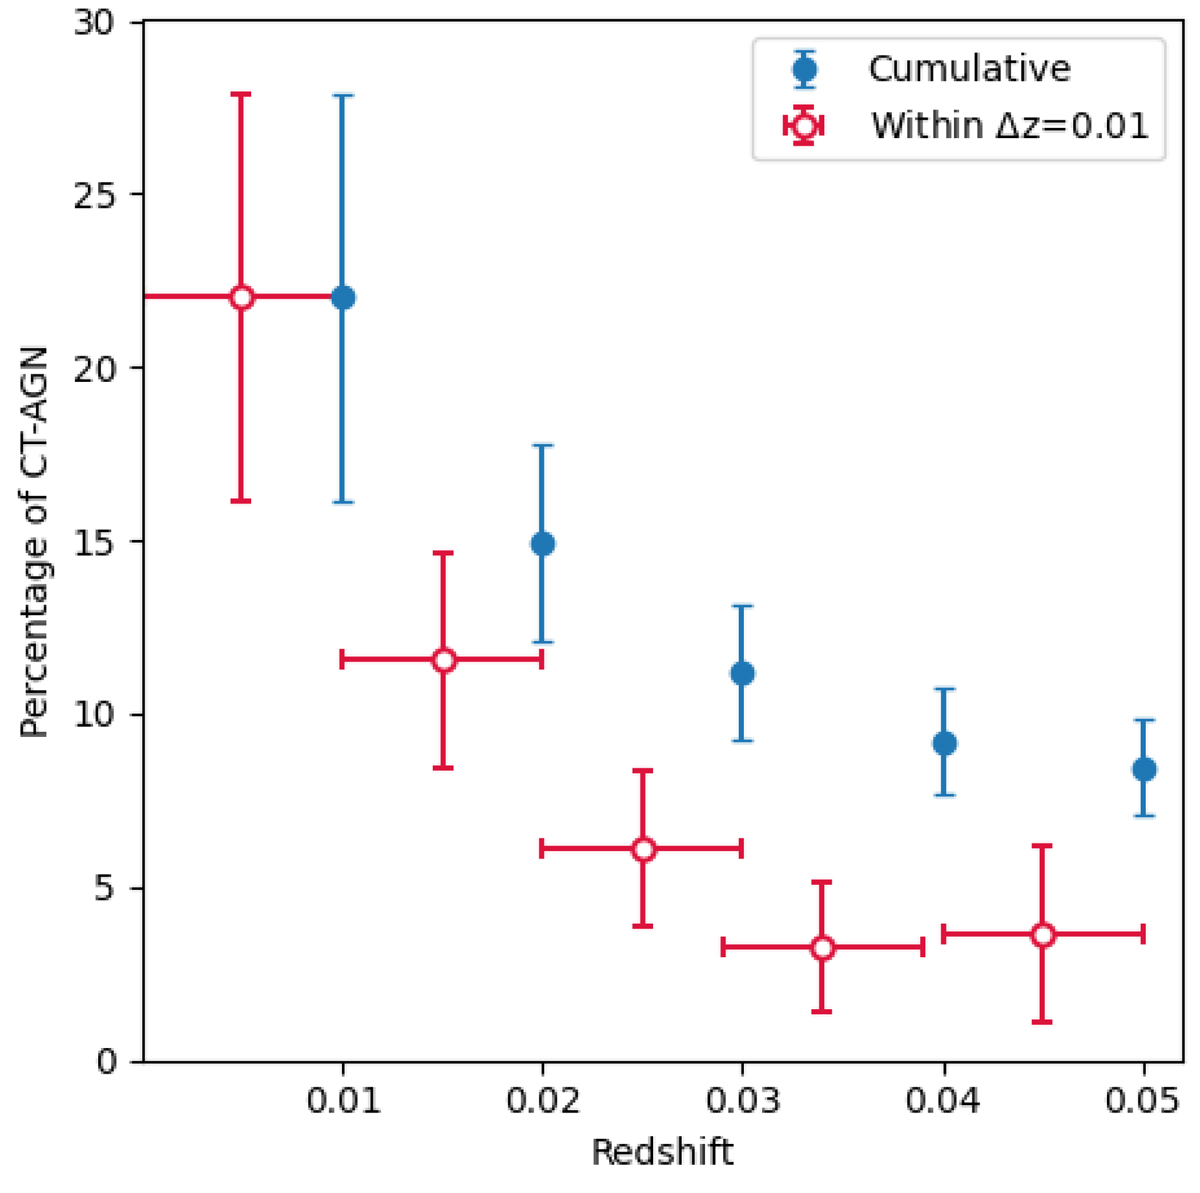
Evolution of observed CT-AGN fraction from the 100 month Swift-BAT catalogue as a function of redshift (for z < 0.05). The red points represent the CT-AGN fraction within the given redshift bin of 0.01 and blue points show the cumulative value of the fraction within the given redshift. The displayed error bars are in binomial statistics. This figure is updated from the CT-AGN fraction plot of Torres-Albà et al. (2021).
Current usage metrics show cumulative count of Article Views (full-text article views including HTML views, PDF and ePub downloads, according to the available data) and Abstracts Views on Vision4Press platform.
Data correspond to usage on the plateform after 2015. The current usage metrics is available 48-96 hours after online publication and is updated daily on week days.
Initial download of the metrics may take a while.