Fig. 3.
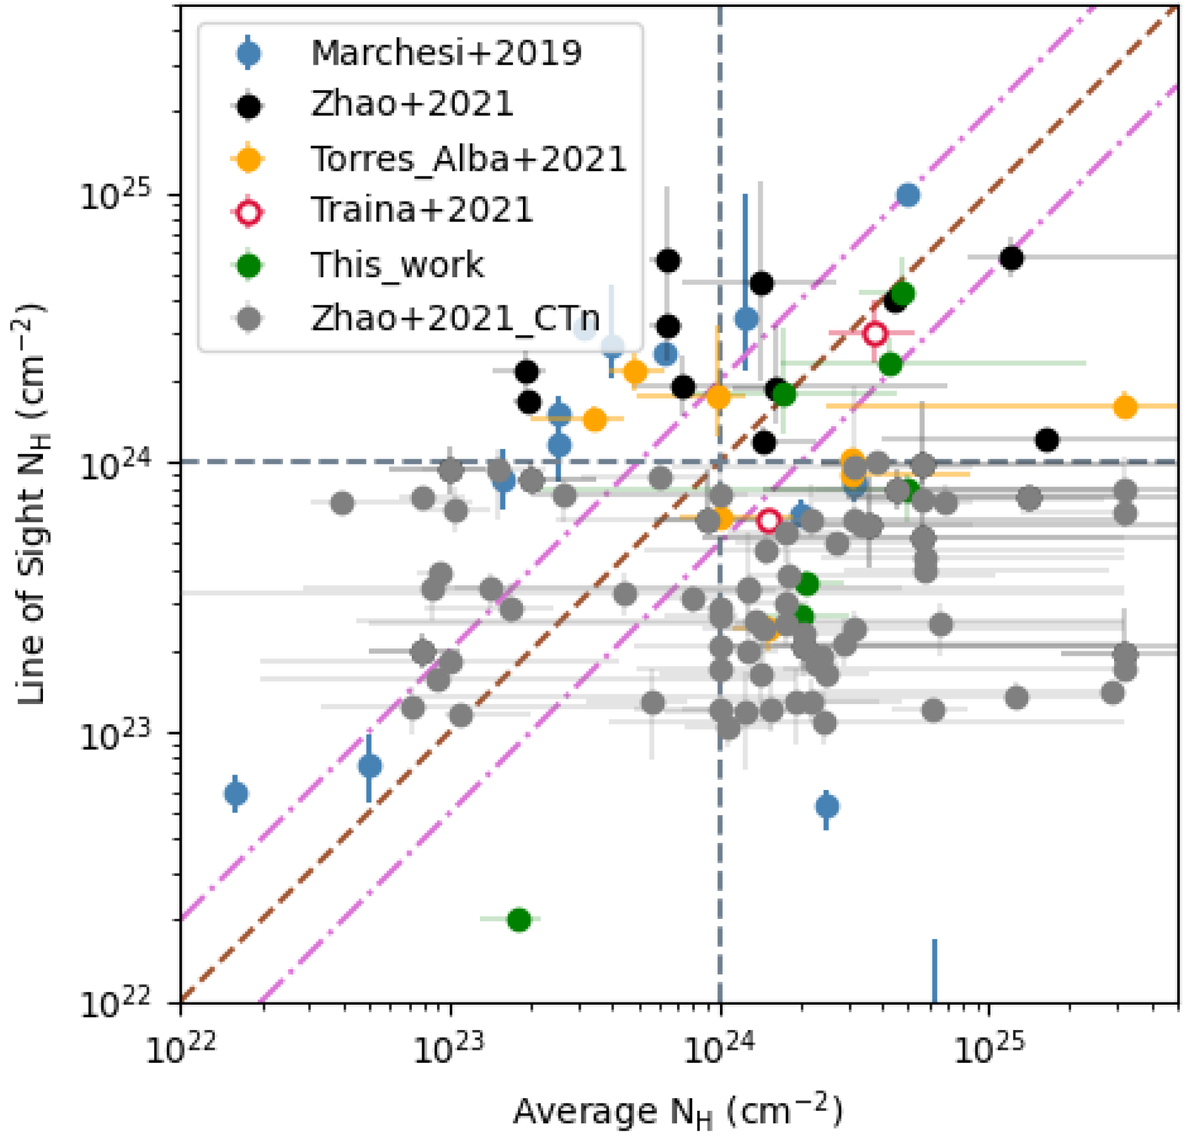
Download original image
Census of the previous results of CT-AGN candidates (selected from Ricci et al. 2015) having z < 0.01 with archival NuSTAR data, analysed by the Clemson-INAF group: Marchesi et al. (2018), Zhao et al. (2021), Torres-Albà et al. (2021), Traina et al. (2021) and including our analysis. The sample of these CT-AGN candidates are marked as large circles. In the parameter space of average vs LOS column density, grey-dashed lines drawn horizontally and vertically marks the CT column density threshold. The brown-dashed diagonal line (i.e the “Line of Homogeneity”) identifies an homogeneous obscuring material distribution. The region within the pink dot-dashed lines is used to classify the number of sources with homogeneous torus. We also included the sample of 74 Compton-Thin sources from Zhao et al. (2021), shown as small grey circles.
Current usage metrics show cumulative count of Article Views (full-text article views including HTML views, PDF and ePub downloads, according to the available data) and Abstracts Views on Vision4Press platform.
Data correspond to usage on the plateform after 2015. The current usage metrics is available 48-96 hours after online publication and is updated daily on week days.
Initial download of the metrics may take a while.