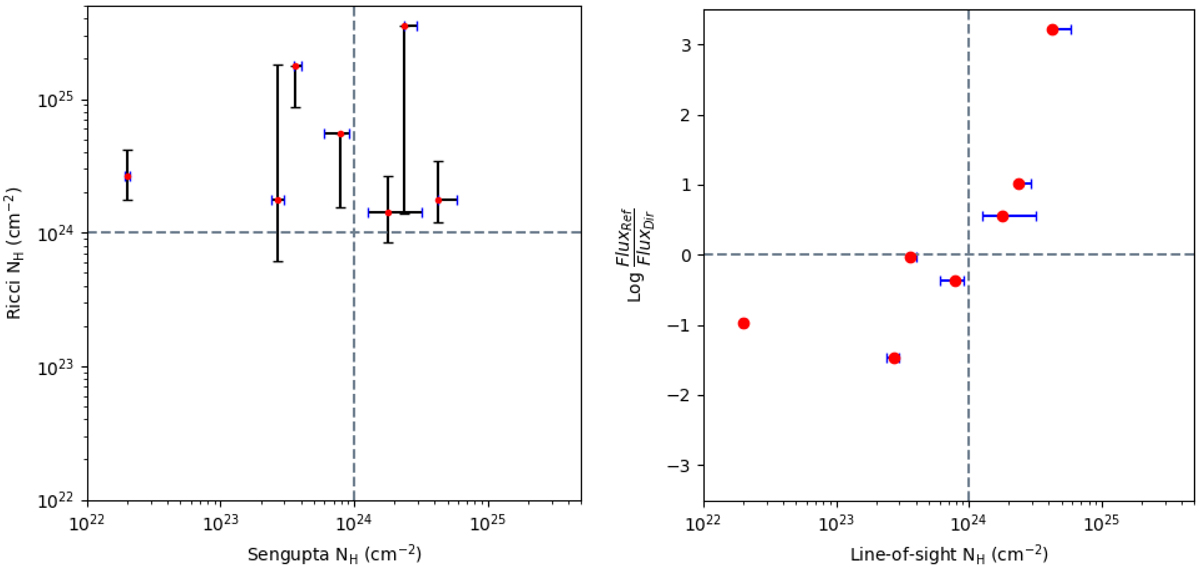
Fig. 2.
Download original image
Comparisons of X-ray spectral properties of the seven sources. Left: comparison of the LOS column density values (as red dot) and its uncertainty values from Ricci et al. (2015) (black markers) with those of the present study (blue markers). The horizontal and vertical grey-dashed lines classify the CT column density threshold. Right: observed (i.e. non-absorption corrected) flux ratio of the reflected component over the direct transmitted component in the 2–10 keV band for each source of our sample, plotted along the LOS column density on the X-axis.
Current usage metrics show cumulative count of Article Views (full-text article views including HTML views, PDF and ePub downloads, according to the available data) and Abstracts Views on Vision4Press platform.
Data correspond to usage on the plateform after 2015. The current usage metrics is available 48-96 hours after online publication and is updated daily on week days.
Initial download of the metrics may take a while.