Fig. 1.
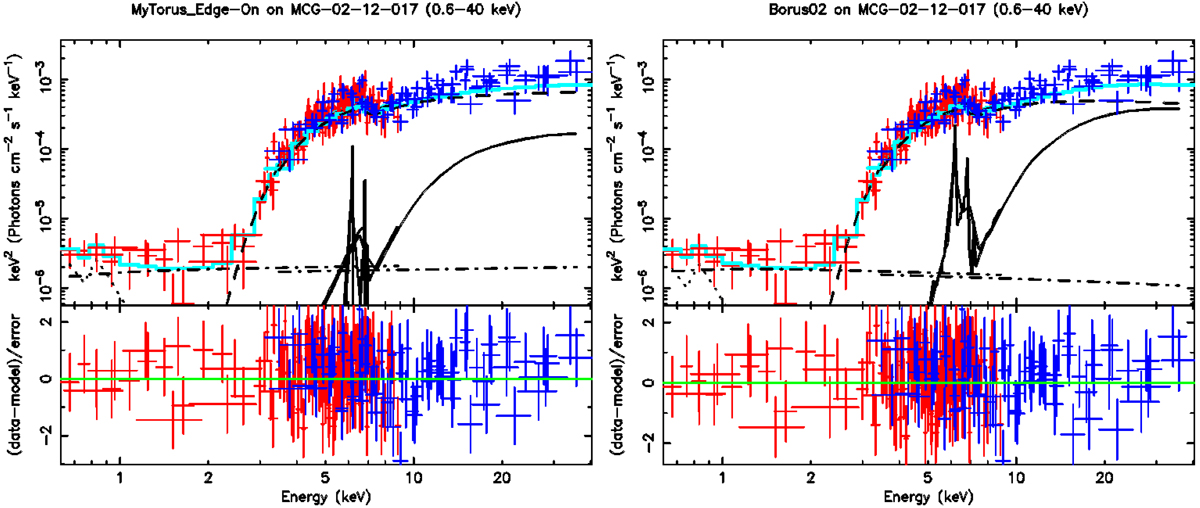
Download original image
X-ray spectral fitting of decoupled Edge-On MYTorus (left) and borus02 (right) models of MCG-02-12-017 data. In both the plots, the soft X-ray data (from XMM-Newton) are marked in red and hard X-ray data (from NuSTAR) are marked in blue. The joint best-fit model in both soft and hard X-rays is plotted as a cyan line. The individual model components are shown as black lines as follows: direct power-law emission (dashed), reflected emission (solid), scattered emission (dot-dashed), iron line (solid; in MYTorus it is separate, in borus02 it is included in reflected emission), and mekal (dotted).
Current usage metrics show cumulative count of Article Views (full-text article views including HTML views, PDF and ePub downloads, according to the available data) and Abstracts Views on Vision4Press platform.
Data correspond to usage on the plateform after 2015. The current usage metrics is available 48-96 hours after online publication and is updated daily on week days.
Initial download of the metrics may take a while.