Fig. 9
Download original image
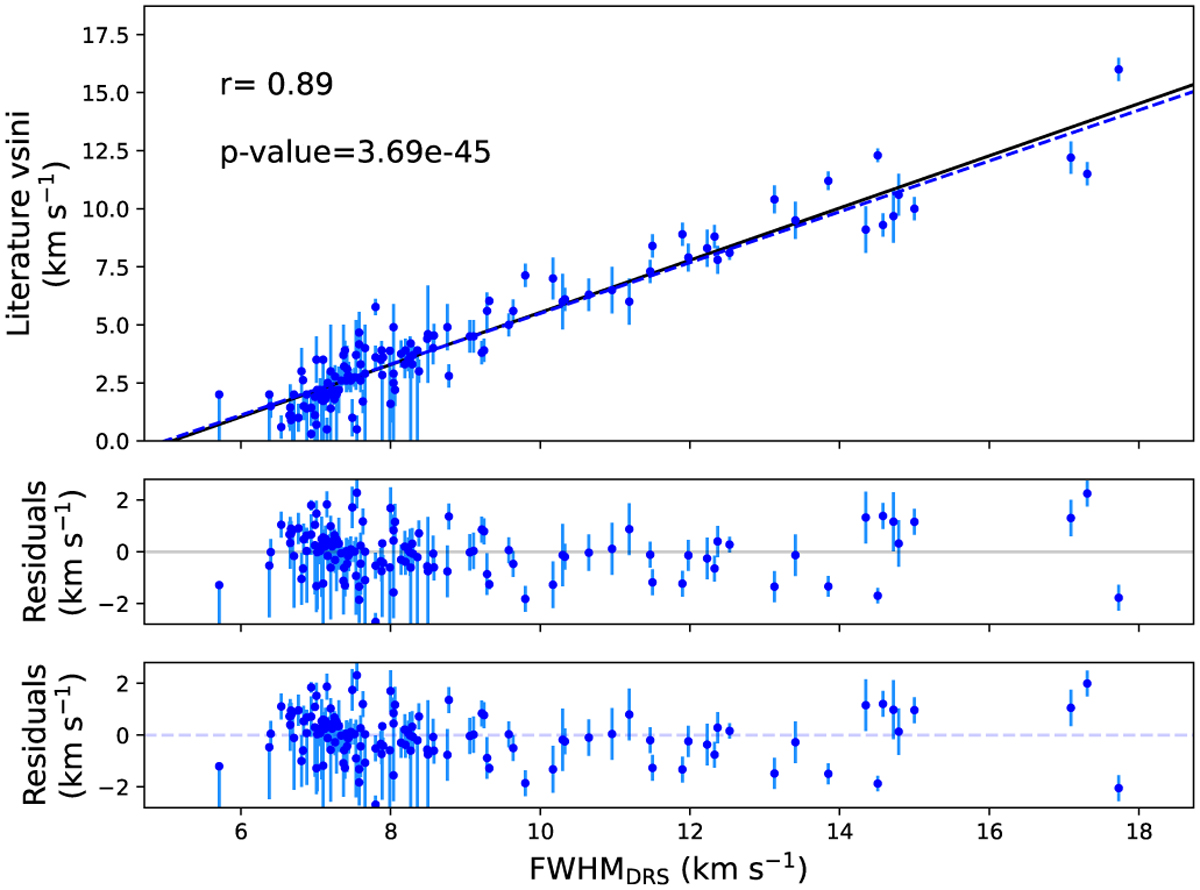
Comparison between the G2 FWHMDRS and the literature veq sin i★ values. Upper panel: correlation between the G2 FWHMDRS (x-axis) and the literature veq sin i★ values (y-axis), with the Spearman’s correlation coefficient r and p-value shown in the plot. The black line shows the linear fit of the data, and the blue dashed line shows the relation obtained from our selected calibrators (Eq. (7)). Middle panel: residuals of the linear fitting. Lower panel: residuals of the relation from selected calibrators.
Current usage metrics show cumulative count of Article Views (full-text article views including HTML views, PDF and ePub downloads, according to the available data) and Abstracts Views on Vision4Press platform.
Data correspond to usage on the plateform after 2015. The current usage metrics is available 48-96 hours after online publication and is updated daily on week days.
Initial download of the metrics may take a while.