Open Access
Fig. 7
Download original image
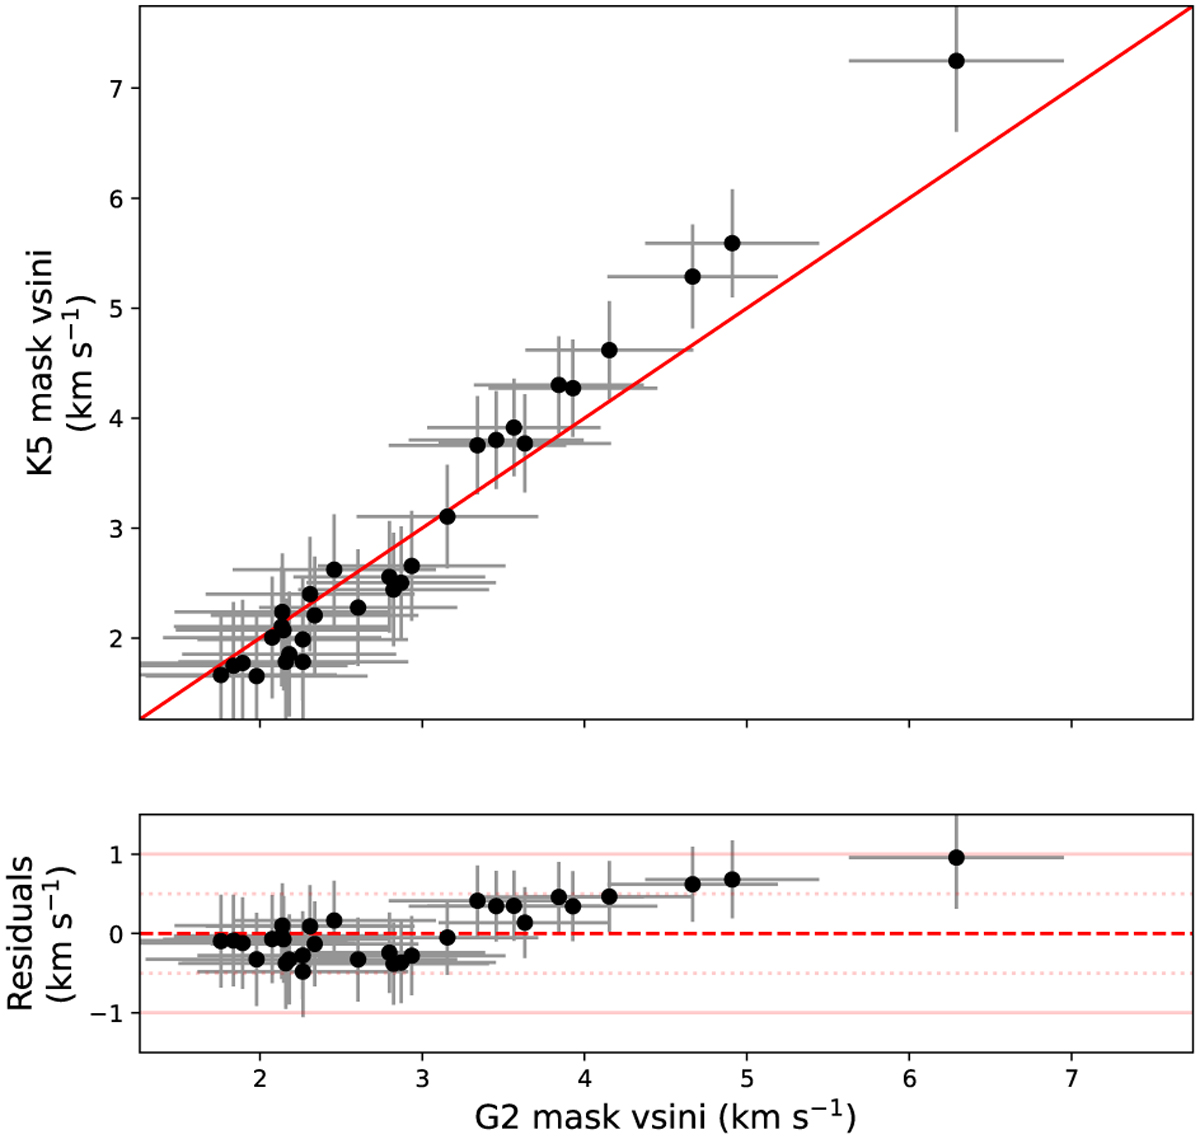
Results obtained with the G2 and the K5 relations for a subset of stars where both CCFs are available. Upper panel: comparison between veq sin i★ obtained with the G2 relation (x-axis) and the K5 relation (y/-axis). The red line shows the one-to-one correlation. Lower panel: residuals.
Current usage metrics show cumulative count of Article Views (full-text article views including HTML views, PDF and ePub downloads, according to the available data) and Abstracts Views on Vision4Press platform.
Data correspond to usage on the plateform after 2015. The current usage metrics is available 48-96 hours after online publication and is updated daily on week days.
Initial download of the metrics may take a while.