Fig. 6
Download original image
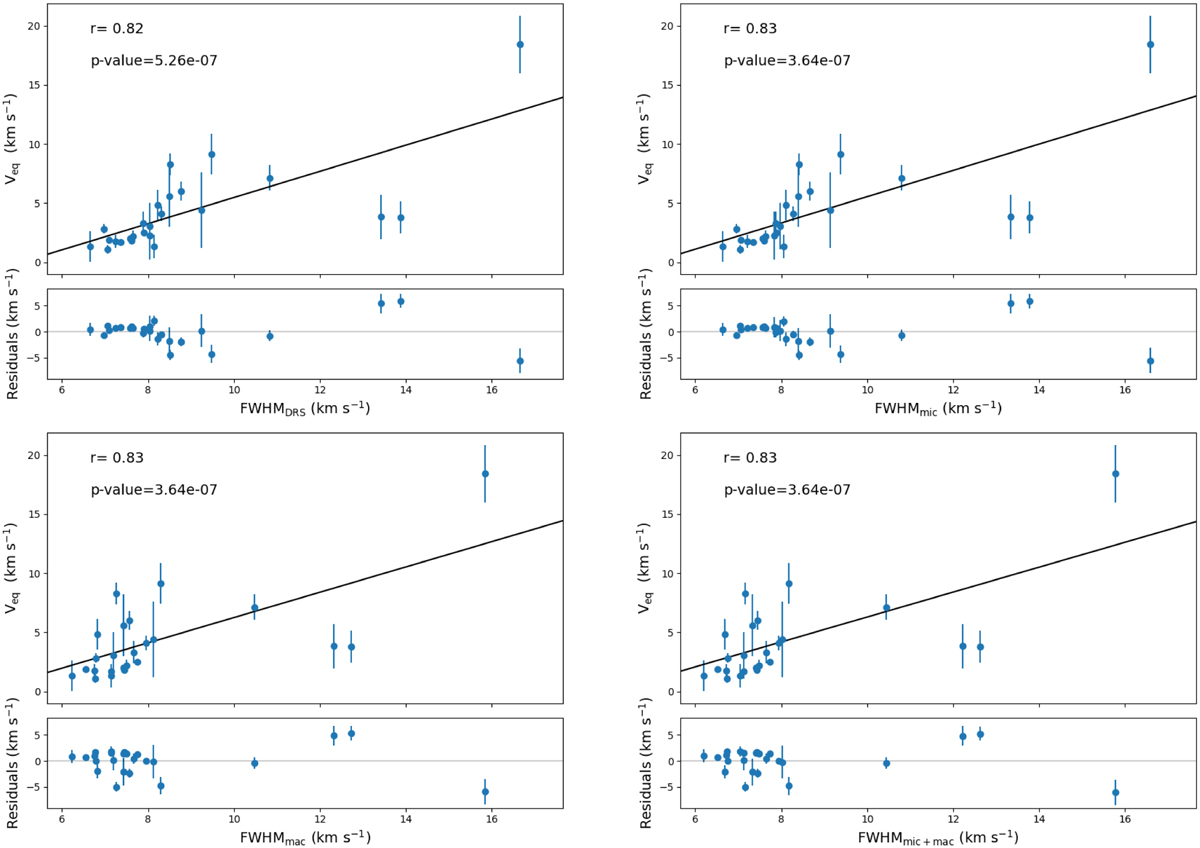
Linear correlations (black solid lines) between the four data sets derived from the FWHMDRS computed by the HARPS-N DRS with the G2 mask (x-axis) and the stellar equatorial velocity veq (y-axis) for our set of calibrators. The Spearman’s correlation coefficient r and p-value are shown in the plots. Upper left: linear correlation between FWHMDRS and veq and relative residuals. Upper right: linear correlation between FWHMmic and veq and relative residuals. Lower left: linear correlation between FWHMmac and veq and relative residuals. Lower right: linear correlation between FWHMmic+mac and veq and relative residuals.
Current usage metrics show cumulative count of Article Views (full-text article views including HTML views, PDF and ePub downloads, according to the available data) and Abstracts Views on Vision4Press platform.
Data correspond to usage on the plateform after 2015. The current usage metrics is available 48-96 hours after online publication and is updated daily on week days.
Initial download of the metrics may take a while.