Fig. 4
Download original image
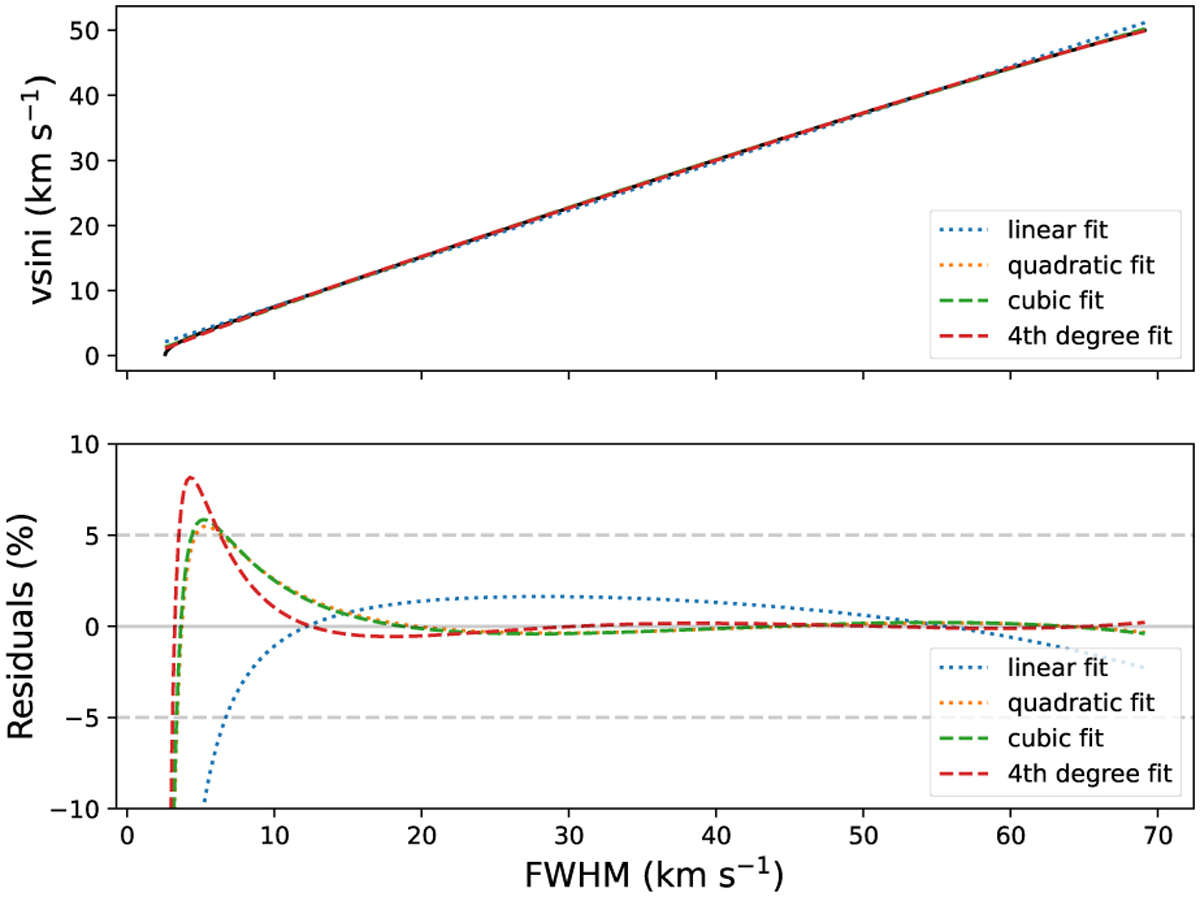
Correlation between the Gaussian fit’s FWHM and the input veq sin i★ of the synthetic line profiles in the whole 0–50 km s−1 weq sin i★ (0–70 km s−1 FWHM) range. Upper panel: correlation between the FWHM and veq (black line) and the relative linear fit (blue dotted line), quadratic fit (orange dotted line), cubic fit (green dashed line), and fourth degree polynomial fit (red dashed line). Lower panel: residuals of the fits. The horizontal grey lines outline the 5% difference between the fit and the data.
Current usage metrics show cumulative count of Article Views (full-text article views including HTML views, PDF and ePub downloads, according to the available data) and Abstracts Views on Vision4Press platform.
Data correspond to usage on the plateform after 2015. The current usage metrics is available 48-96 hours after online publication and is updated daily on week days.
Initial download of the metrics may take a while.