Fig. 2
Download original image
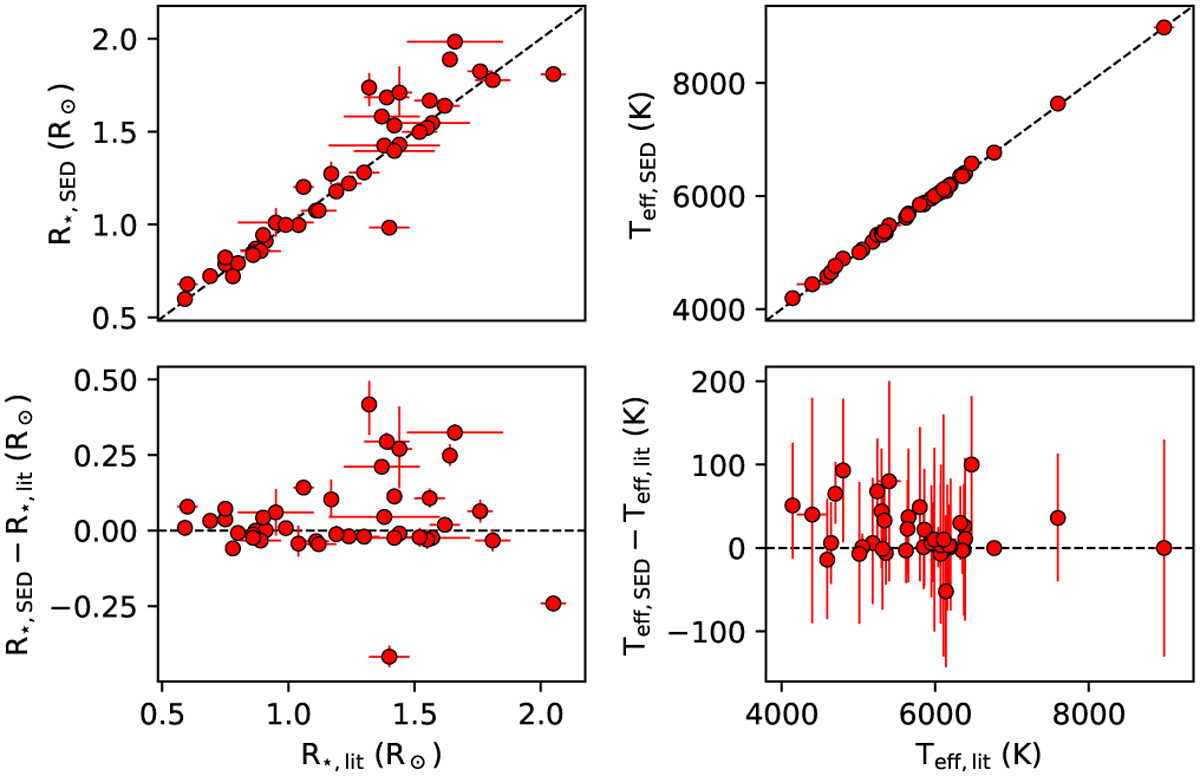
Comparison of the stellar radii and effective temperatures obtained via the SED fitting described in Sect. 2 with literature values. Upper panels: correlations’ plot between our values and the literature ones for R★ (left panel) and Teff (right panel). Lower panels: residual plots showing the difference between our values and the literature ones.
Current usage metrics show cumulative count of Article Views (full-text article views including HTML views, PDF and ePub downloads, according to the available data) and Abstracts Views on Vision4Press platform.
Data correspond to usage on the plateform after 2015. The current usage metrics is available 48-96 hours after online publication and is updated daily on week days.
Initial download of the metrics may take a while.