Fig. 16
Download original image
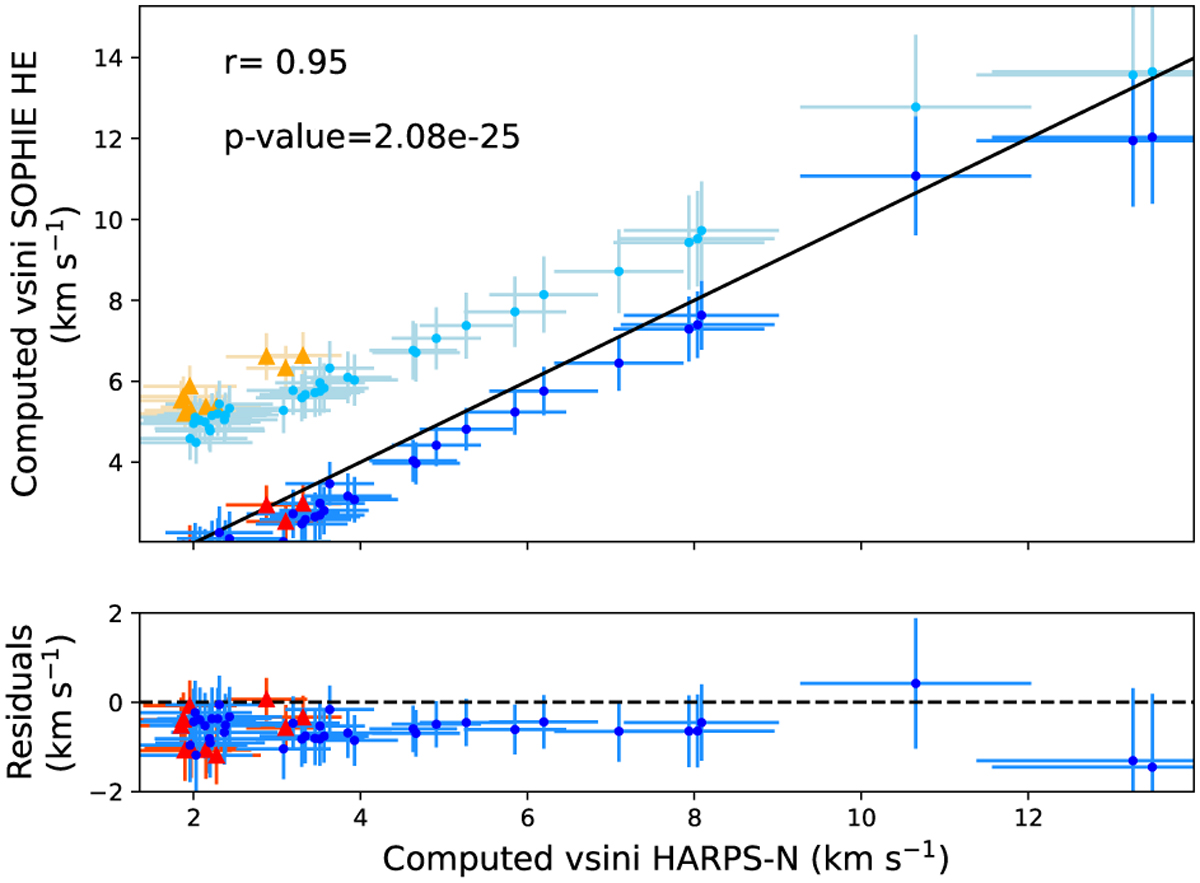
Comparison between veq sin i★ computed from the HARPS-N FWHMDRS (x-axis) and those computed with SOPHIE in HE mode (y-axis). Upper panel: orange triangles and light blue dots are the results from SOPHIE HE FWHMDRS with the K5 and G2 relation, respectively, while the red triangles and blue dots are the results from the corrected SOPHIE HE FWHMnew (y-axis). The black line shows the one-to-one correlation. Lower panel: residuals for the corrected SOPHIE HE FWHMnew only.
Current usage metrics show cumulative count of Article Views (full-text article views including HTML views, PDF and ePub downloads, according to the available data) and Abstracts Views on Vision4Press platform.
Data correspond to usage on the plateform after 2015. The current usage metrics is available 48-96 hours after online publication and is updated daily on week days.
Initial download of the metrics may take a while.