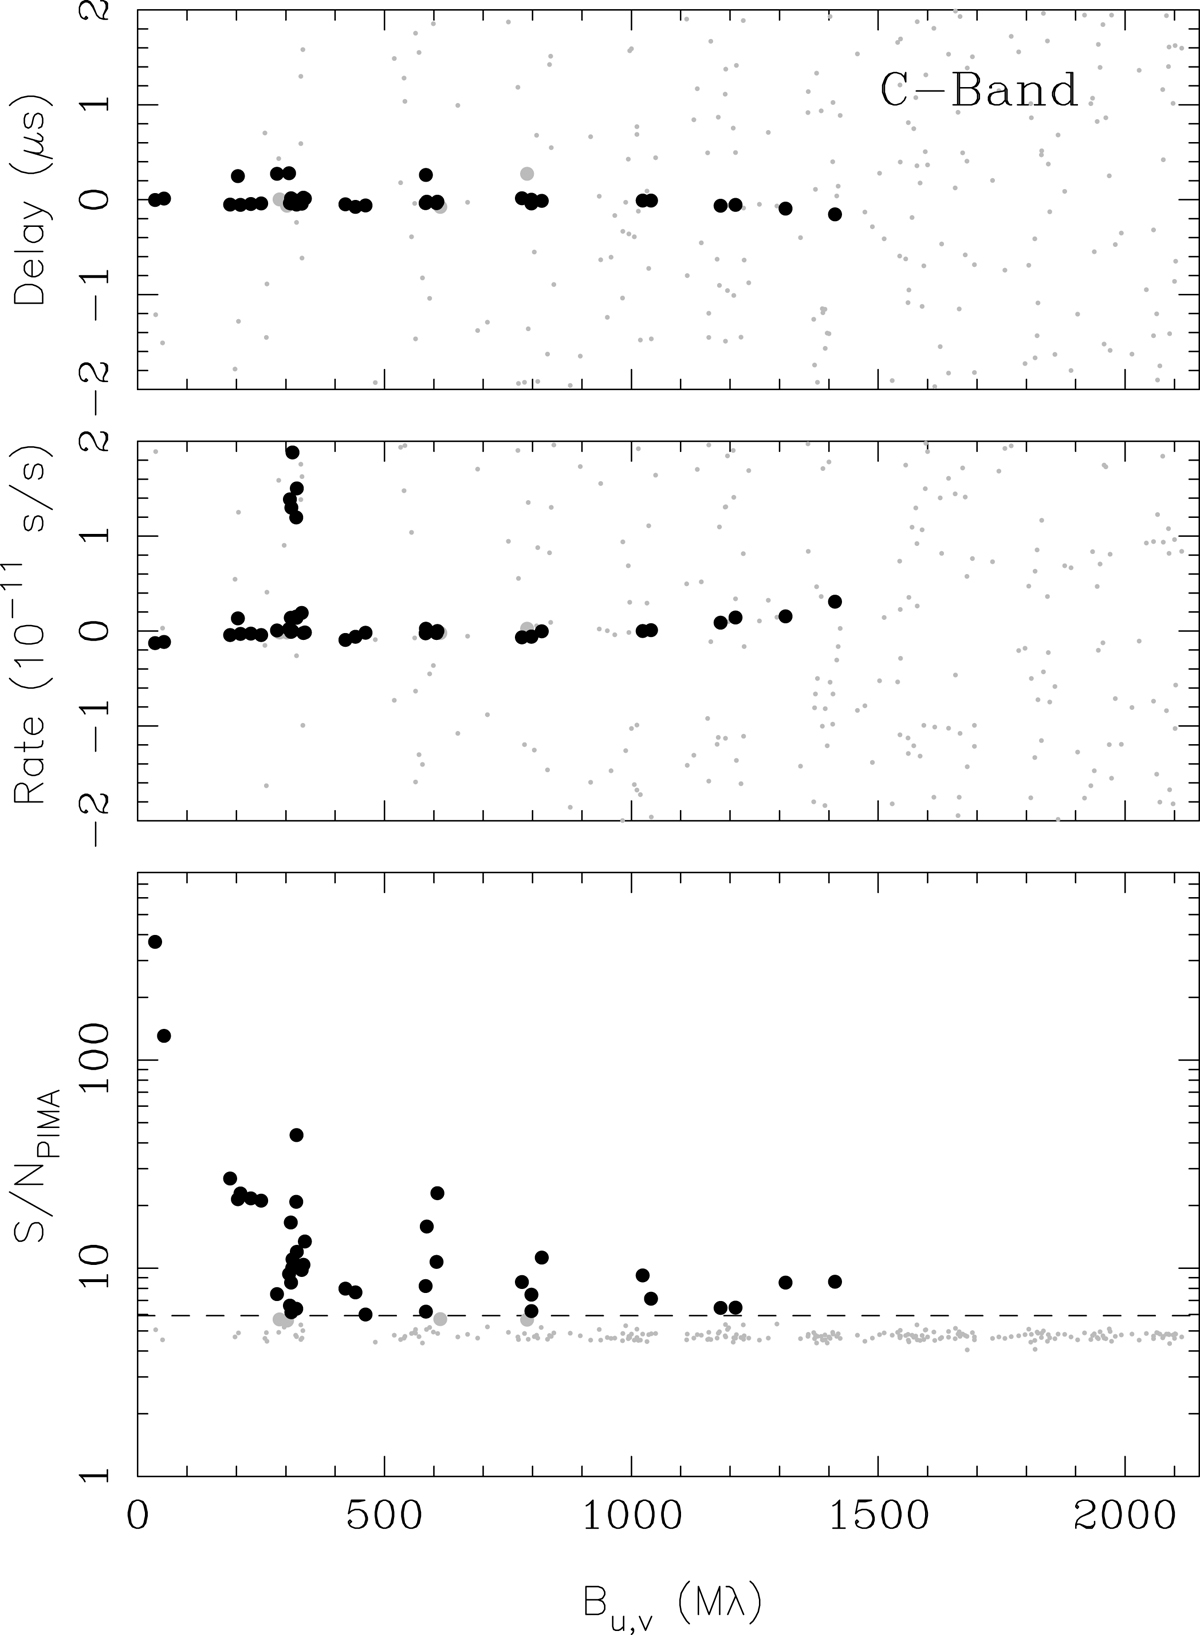
Fig. 2.
Download original image
Results of the initial C band fringe search on RadioAstron baselines using PIMA. Delay (top panel), rate (middle panel), and S/N (bottom panel) of the PIMA fringe-fit solutions are plotted against the projected baseline length (in Mλ). Large black dots correspond to solutions that have S/NPIMA higher than the detection threshold of 5.92, which is indicated by the dashed line in the bottom panel. Large grey dots are solutions with 5.52 < S/NPIMA ≤ 5.92 (potential detections) and small grey dots are solutions with S/NPIMA ≤ 5.52 (non-detections).
Current usage metrics show cumulative count of Article Views (full-text article views including HTML views, PDF and ePub downloads, according to the available data) and Abstracts Views on Vision4Press platform.
Data correspond to usage on the plateform after 2015. The current usage metrics is available 48-96 hours after online publication and is updated daily on week days.
Initial download of the metrics may take a while.