Fig. A.2.
Download original image
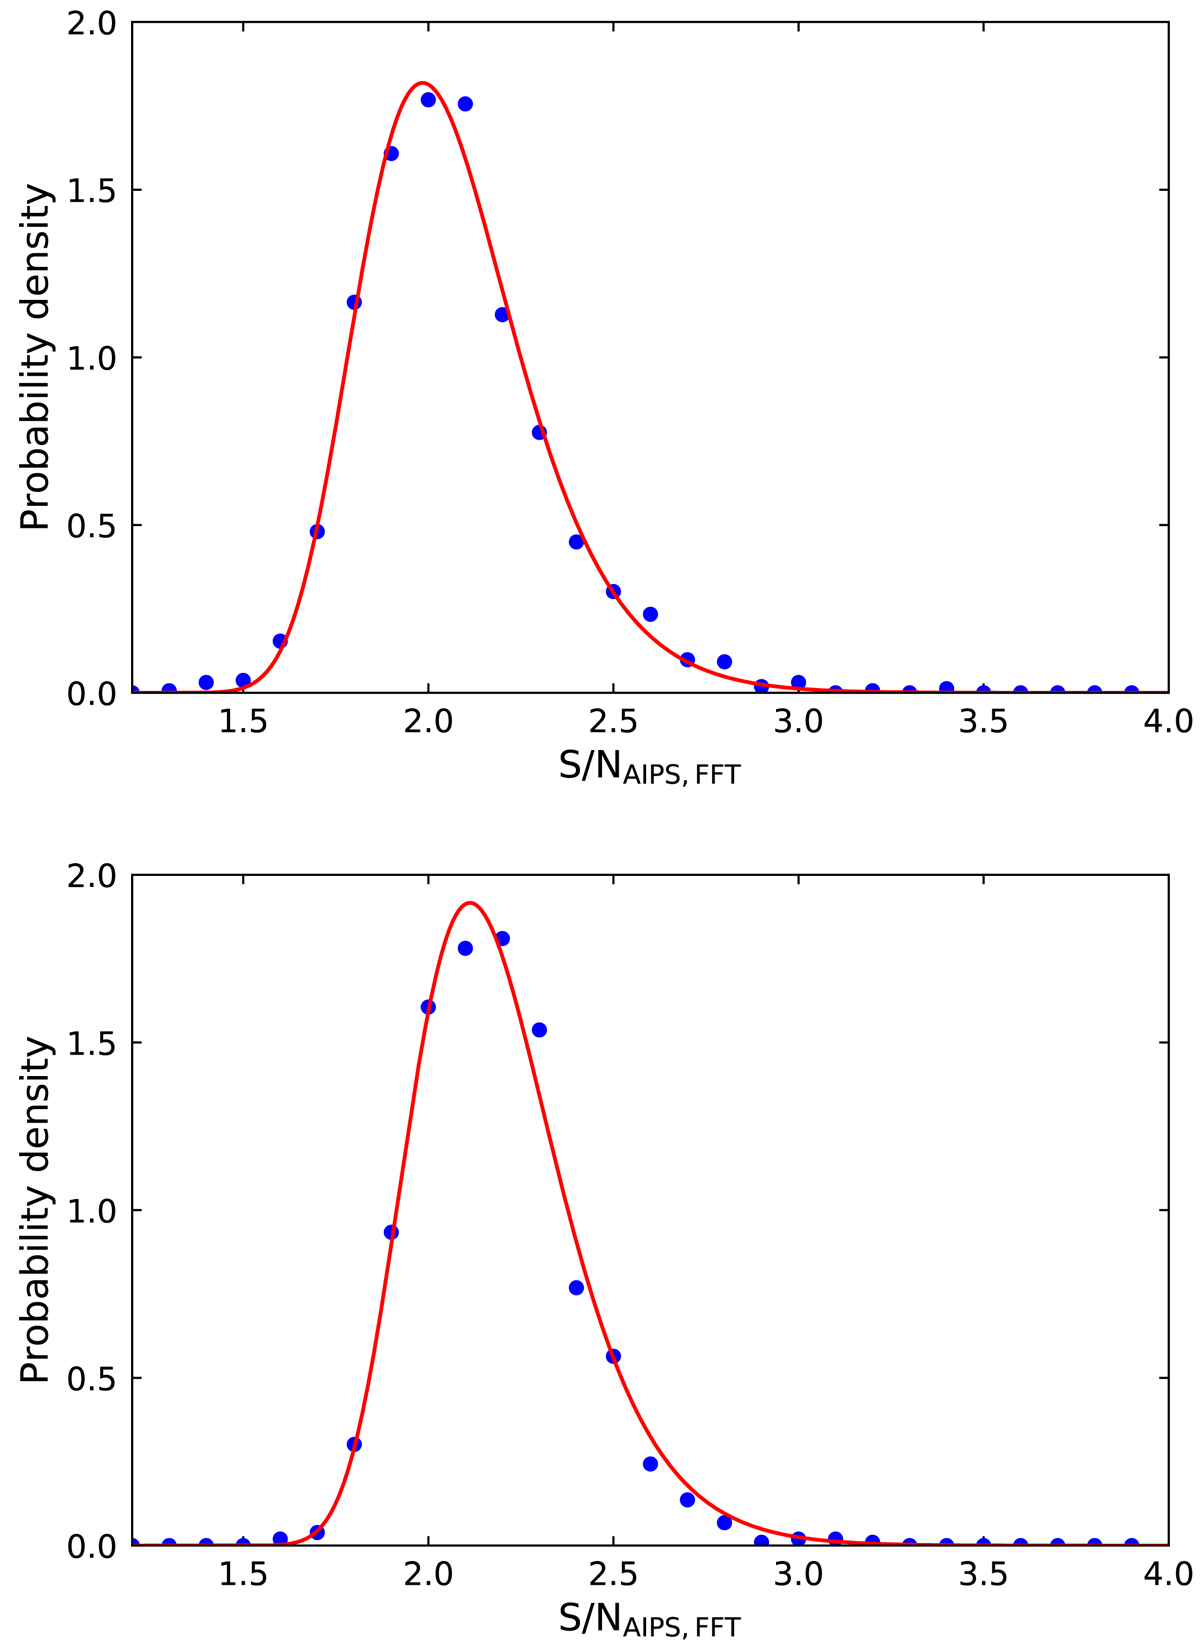
Empirical distribution of the maximum S/NAIPS, FFT of the fringe amplitude in the FFT stage of the AIPS fringe-fitting task FRING in the C band (top) and K band (bottom) when no signal was present in the chosen search region (blue points). The search window is constrained to be ±100 ns in delay and ±25 mHz (C band) or ±50 mHz (K band) in rate. The red curve shows the fitted theoretical probability distribution. Note: in addition to a very large difference in the search space size between Figs. A.1 and A.2, S/NPIMA and S/NAIPS, FFT are also defined differently.
Current usage metrics show cumulative count of Article Views (full-text article views including HTML views, PDF and ePub downloads, according to the available data) and Abstracts Views on Vision4Press platform.
Data correspond to usage on the plateform after 2015. The current usage metrics is available 48-96 hours after online publication and is updated daily on week days.
Initial download of the metrics may take a while.