Fig. 8
Download original image
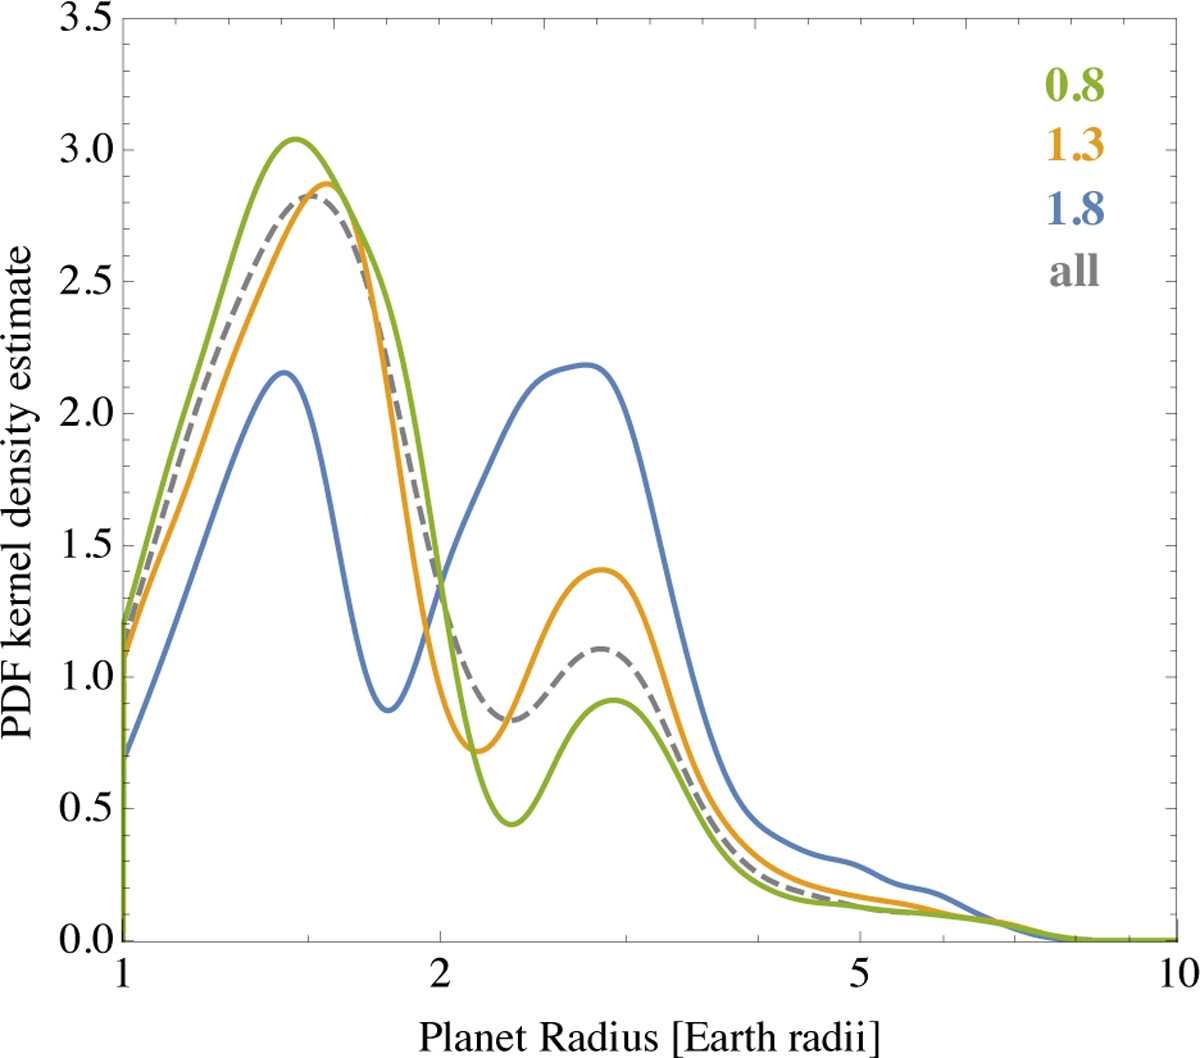
Kernel density estimate of the distribution of the radii in the biased synthetic population obtained with the hydrodynamic escape model. The grey dashed line includes all detectable planet (at all orbital periods). The green, orange, and blue lines include planets with log (period/day) of 0.8 ± 0.1, 1.3 ± 0.1, and 1.8 ± 0.1. One sees how the centre of the valley shifts to smaller radii with increasing orbital period.
Current usage metrics show cumulative count of Article Views (full-text article views including HTML views, PDF and ePub downloads, according to the available data) and Abstracts Views on Vision4Press platform.
Data correspond to usage on the plateform after 2015. The current usage metrics is available 48-96 hours after online publication and is updated daily on week days.
Initial download of the metrics may take a while.