Fig. 7
Download original image
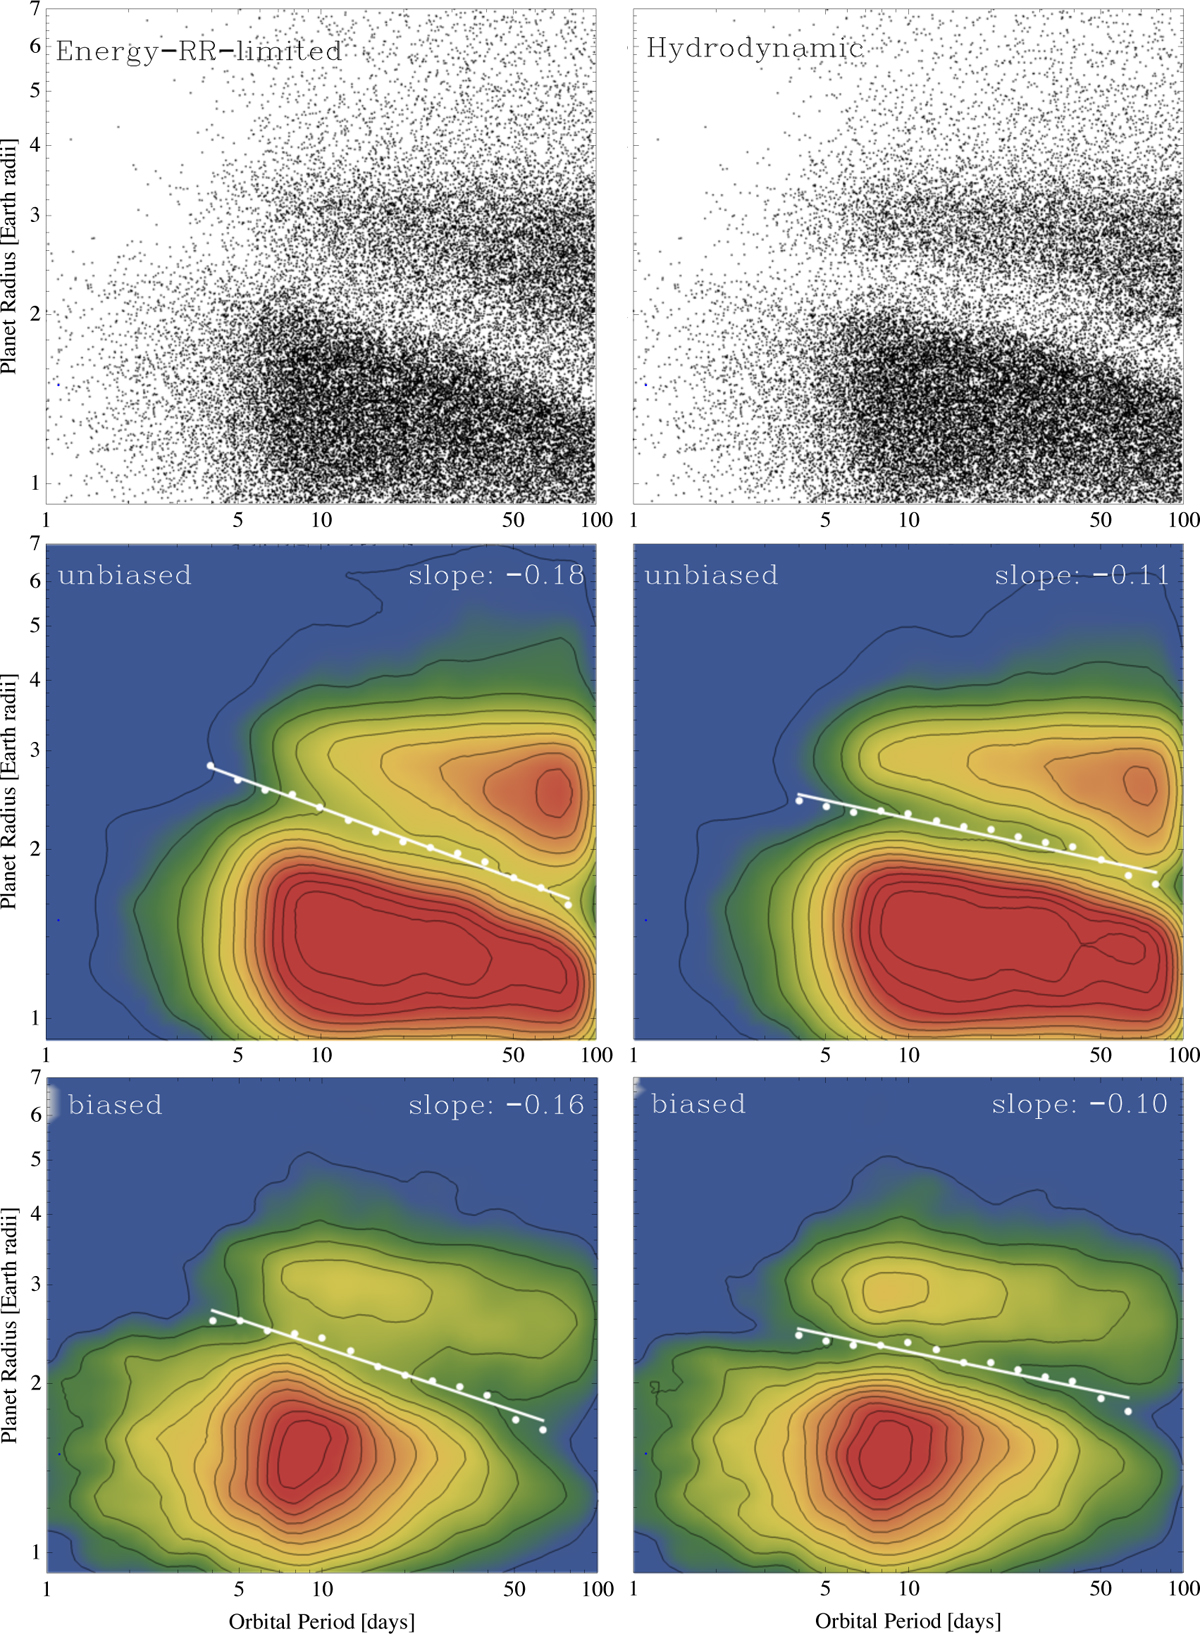
Transit radius as a function of orbital period at 5 Gyr for distributions of the initial envelope mass, core mass, and orbital period derived from Kepler observations (Rogers & Owen 2021). Left column: energy- and radiation-recombination-limited escape model. Right column: hydrodynamic escape model. Top row: raw scatter plot of the unbiased synthetic populations. Middle row: 2D Gaussian Kernel Density Estimation of the unbiased synthetic populations. Bottom row: as in the middle, but after applying a detection bias representative of the Kepler survey, which disfavours small distant planets. White dots and lines indicate the valley position. One notes in all cases the shallower slope in the hydrodynamic model.
Current usage metrics show cumulative count of Article Views (full-text article views including HTML views, PDF and ePub downloads, according to the available data) and Abstracts Views on Vision4Press platform.
Data correspond to usage on the plateform after 2015. The current usage metrics is available 48-96 hours after online publication and is updated daily on week days.
Initial download of the metrics may take a while.