Fig. 6
Download original image
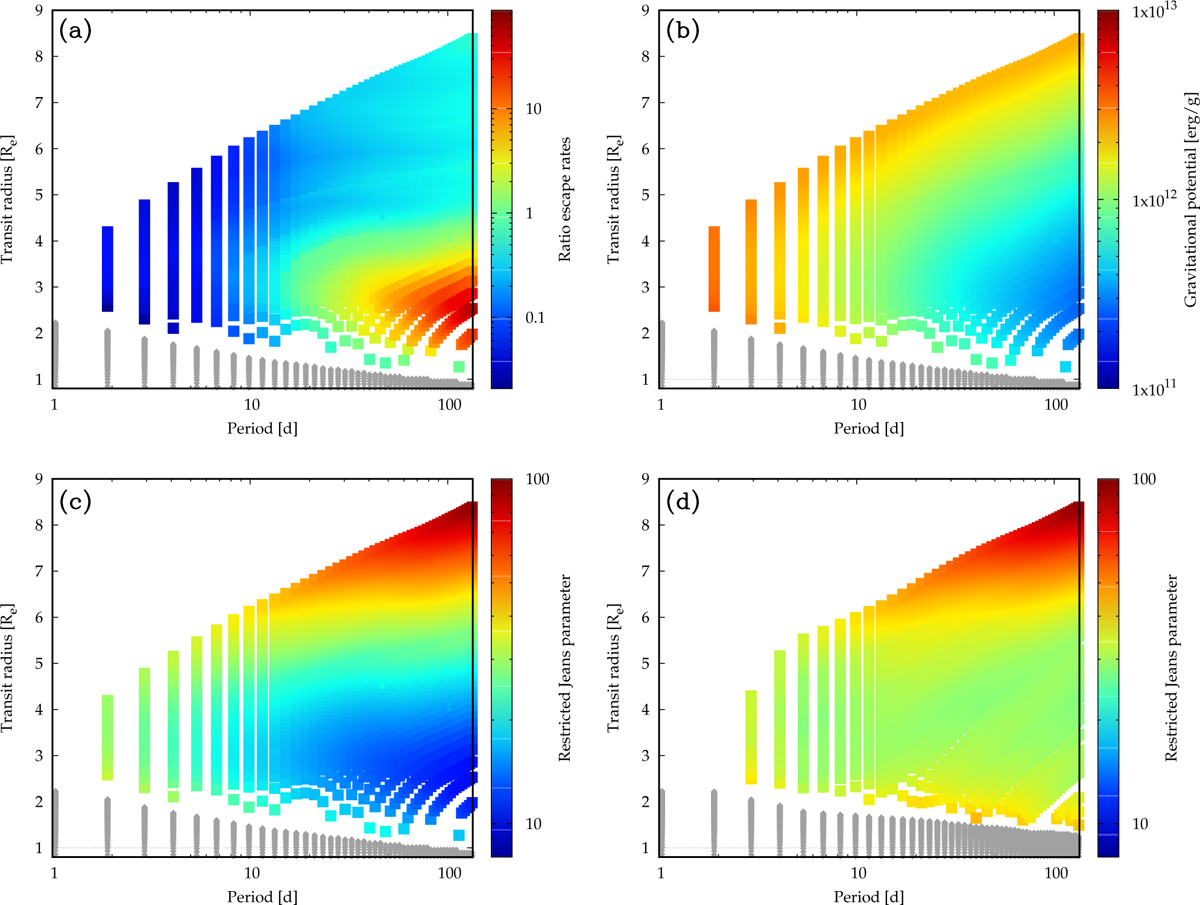
Comparison of the two escape models at 50 Myr in the orbital period-transit radius plane. In panels a, b, and c, the energy- and recombination-limited model is displayed while panel d displays the hydrodynamic model. In panel a, the colour code shows the ratio of the instantaneous escape rates predicted by the two models, Ṁhyd/ṀenRR One notes how the hydrodynamic model predicts higher escape rates for the distant small planets, but lower ones for the close-in planets. Panel b shows the gravitational potential of the planets. Panels c and d colour code the restricted Jeans parameter Λ. On the right, no Λ ≲ 30 occur, as the excess envelope has already boiled-off. Grey points are planets that have lost the entire H and He envelope.
Current usage metrics show cumulative count of Article Views (full-text article views including HTML views, PDF and ePub downloads, according to the available data) and Abstracts Views on Vision4Press platform.
Data correspond to usage on the plateform after 2015. The current usage metrics is available 48-96 hours after online publication and is updated daily on week days.
Initial download of the metrics may take a while.