Fig. 3
Download original image
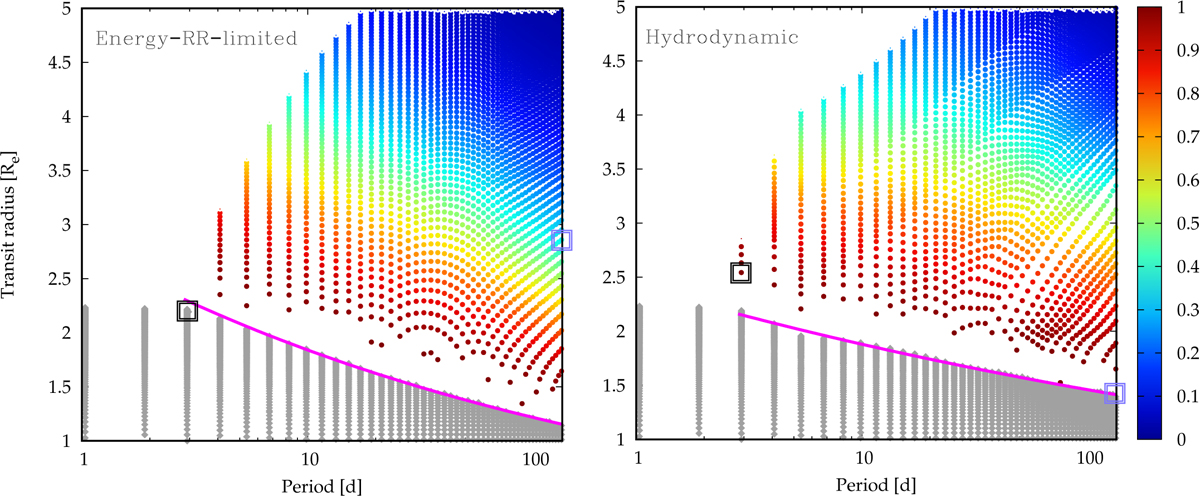
Results of planet evolution simulations in the orbital period-transit radius plane at 5 Gyr (left panel: energy- and recombination-limited model; right panel: hydrodynamic model). Each dot represents a planet which is coloured based on the fraction of its initial H and He envelope mass that was evaporated. Grey symbols indicate a complete loss of the envelope, corresponding to sub-Neptunes that have evolved into super-Earths. The magenta lines show the fit to determine the slope α of the valley as represented by the largest super-Earth at a given period (i.e. the bottom of the valley). We note the shallower slope in the hydrodynamic model. The squares show two individual cases (one far planet in lilac, one close in black). Both start with identical initial conditions in the two models and are discussed in Sect. 4.2. They end up on different sides of the valley in the two models in a way to make the slope shallower in the hydrodynamic model.
Current usage metrics show cumulative count of Article Views (full-text article views including HTML views, PDF and ePub downloads, according to the available data) and Abstracts Views on Vision4Press platform.
Data correspond to usage on the plateform after 2015. The current usage metrics is available 48-96 hours after online publication and is updated daily on week days.
Initial download of the metrics may take a while.