Fig. A.2
Download original image
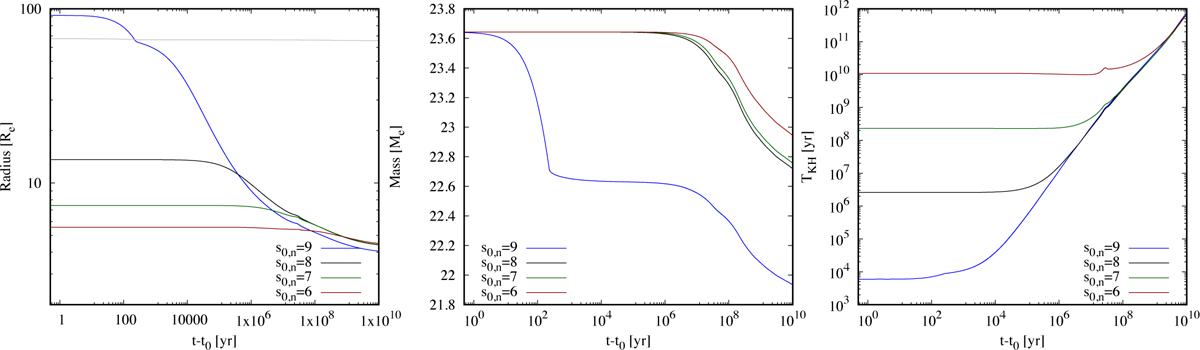
Temporal evolution of the outer radius (left), total mass (middle), and Kelvin-Helmholtz timescale (right panel) for a 23.64 M⊕ planet (Mcore = 20M⊕) at 0.1 AU for the four s0,n indicated in the plots. Time is measured relative to the moment when the simulation starts. In the left panel, the grey line shows the Hill sphere radius. The planet with the (unrealistically) high s0,n = 9 kB/baryon initially overflows the Hill sphere, leading to a strong reduction of the envelope mass. At late times, this leads to a smaller radius. The other three cases which lack this overflow phase given in contrast similar values, with a slight anti-correlation of the radius at late time and the initial entropy.
Current usage metrics show cumulative count of Article Views (full-text article views including HTML views, PDF and ePub downloads, according to the available data) and Abstracts Views on Vision4Press platform.
Data correspond to usage on the plateform after 2015. The current usage metrics is available 48-96 hours after online publication and is updated daily on week days.
Initial download of the metrics may take a while.