Fig. 1
Download original image
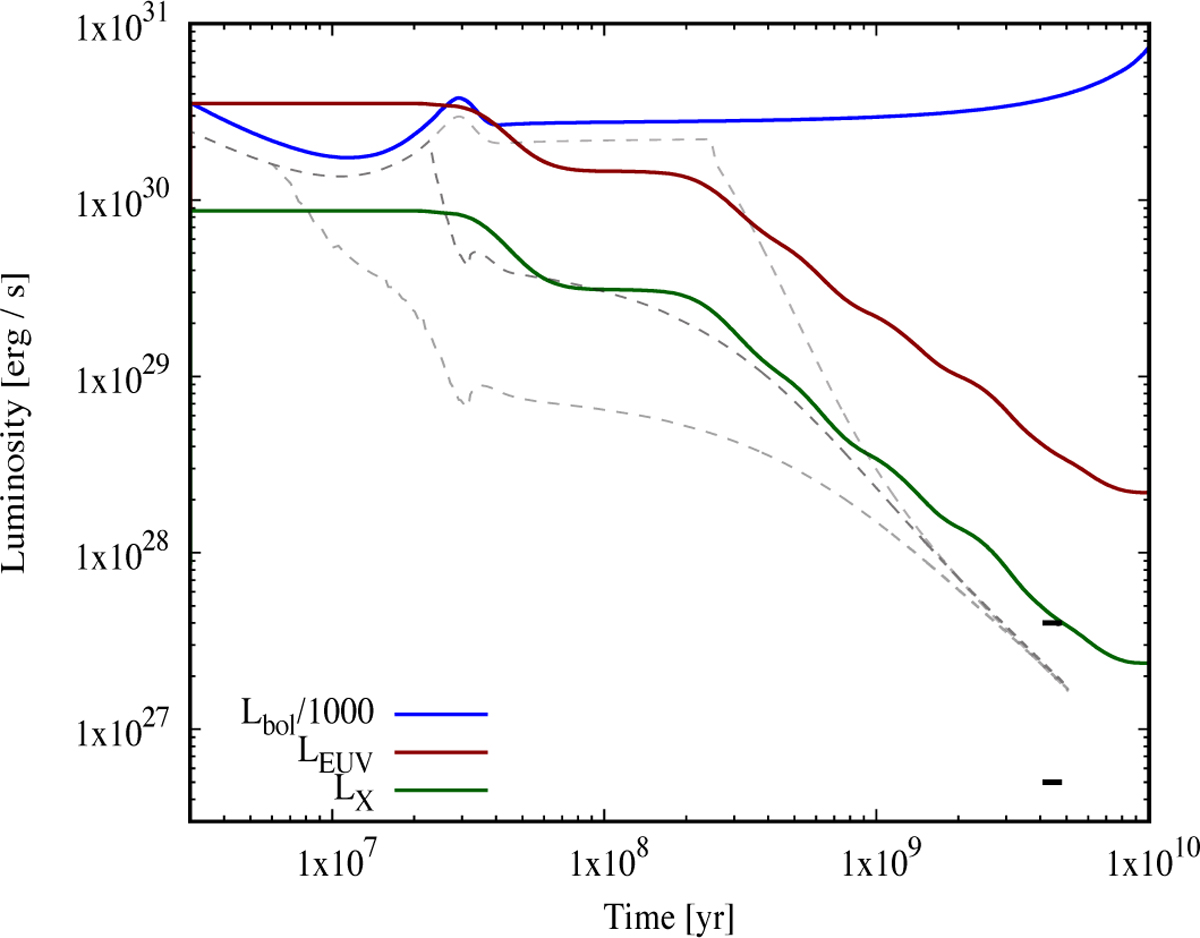
Temporal evolution of the bolometric (blue), X-ray (green), and EUV luminosity (brown) of a 1 M⊙ star as assumed in our model. The bolometric luminosity is divided by a factor 1000 to bring it on a similar scale as LX and LEUV. The two black bars near 4.5 Gyr show the range of our Sun’s LX over the course of a solar cycle. The grey dashed lines show for comparison the LX of Tu et al. (2015) for the 10th, 50th, and 90th percentiles of the rotational distribution.
Current usage metrics show cumulative count of Article Views (full-text article views including HTML views, PDF and ePub downloads, according to the available data) and Abstracts Views on Vision4Press platform.
Data correspond to usage on the plateform after 2015. The current usage metrics is available 48-96 hours after online publication and is updated daily on week days.
Initial download of the metrics may take a while.