Fig. B.1
Download original image
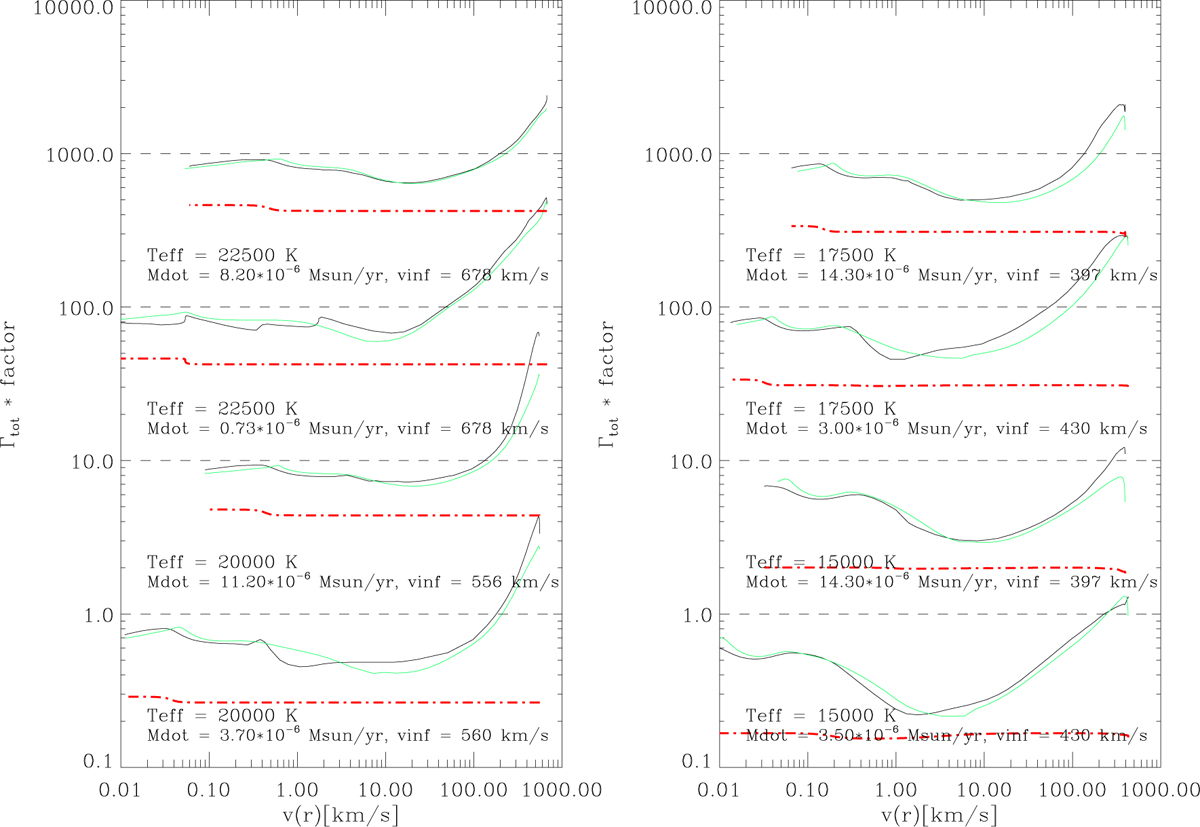
![]() for all models from our grid (see Table B.1), as a function of velocity. Black represents results from FASTWIND v11 and green results from CMFGEN. To improve the visibility, all Γ values have been multiplied with factors 10i, i ∈ [0,4], from bottom to top. The dashed-dotted red lines correspond to Γe(r) for pure electron scattering (its local variation relates to changes in the ionisation structure, mostly of H and He), and the dashed lines indicate, for each model, the relation Γtot = 1. We note that all models displayed here have been calculated with a fixed ß = 1 velocity law, i.e. they are not self-consistent. See text.
for all models from our grid (see Table B.1), as a function of velocity. Black represents results from FASTWIND v11 and green results from CMFGEN. To improve the visibility, all Γ values have been multiplied with factors 10i, i ∈ [0,4], from bottom to top. The dashed-dotted red lines correspond to Γe(r) for pure electron scattering (its local variation relates to changes in the ionisation structure, mostly of H and He), and the dashed lines indicate, for each model, the relation Γtot = 1. We note that all models displayed here have been calculated with a fixed ß = 1 velocity law, i.e. they are not self-consistent. See text.
Current usage metrics show cumulative count of Article Views (full-text article views including HTML views, PDF and ePub downloads, according to the available data) and Abstracts Views on Vision4Press platform.
Data correspond to usage on the plateform after 2015. The current usage metrics is available 48-96 hours after online publication and is updated daily on week days.
Initial download of the metrics may take a while.