Open Access
Fig. 1
Download original image
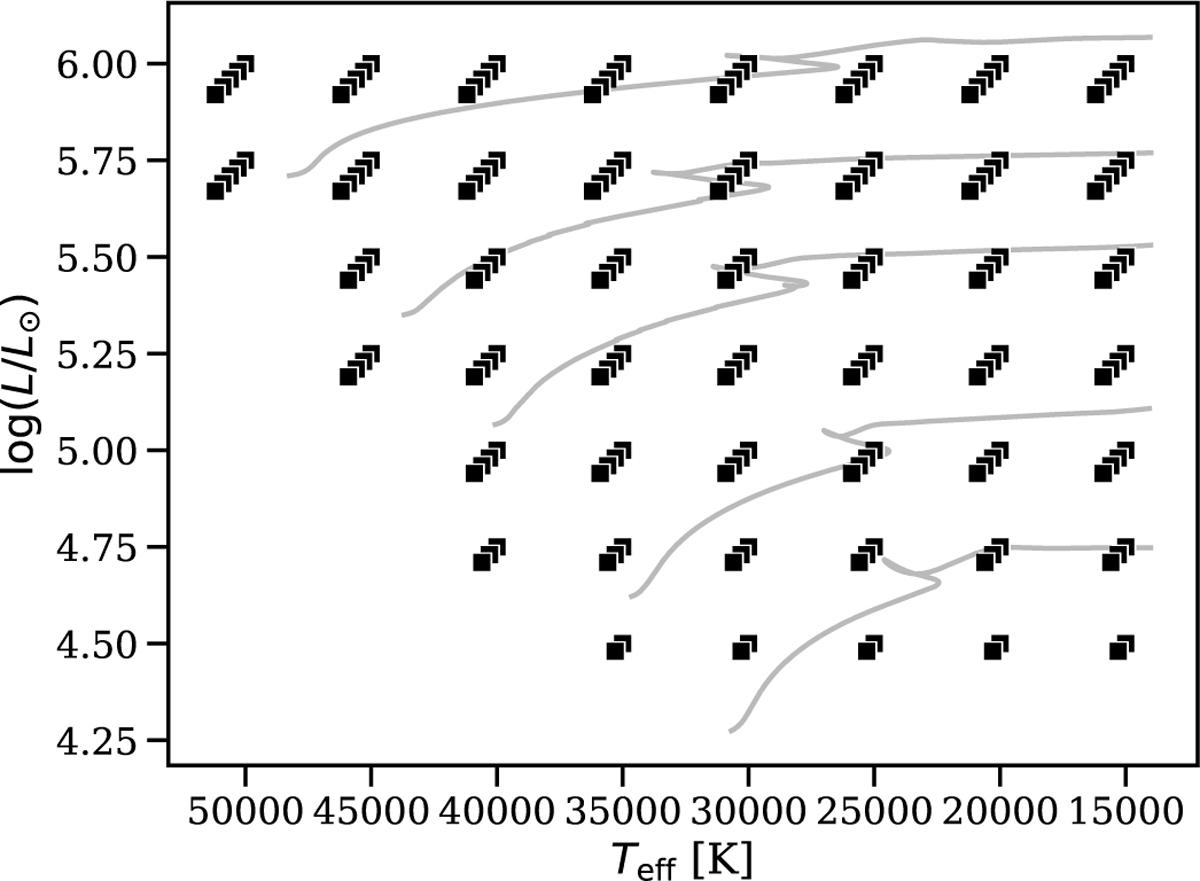
HRD showing the coverage of the grid of models. Each point in the L*-Teff plane represents several models with varying mass, shown by the overlaid squares. Also shown are the stellar tracks including an initial rotation of 0.4 times the critical rotation for 15, 20, 30, 40 and 60 M⊙ stars computed using MESA.
Current usage metrics show cumulative count of Article Views (full-text article views including HTML views, PDF and ePub downloads, according to the available data) and Abstracts Views on Vision4Press platform.
Data correspond to usage on the plateform after 2015. The current usage metrics is available 48-96 hours after online publication and is updated daily on week days.
Initial download of the metrics may take a while.