Fig. 8

Download original image
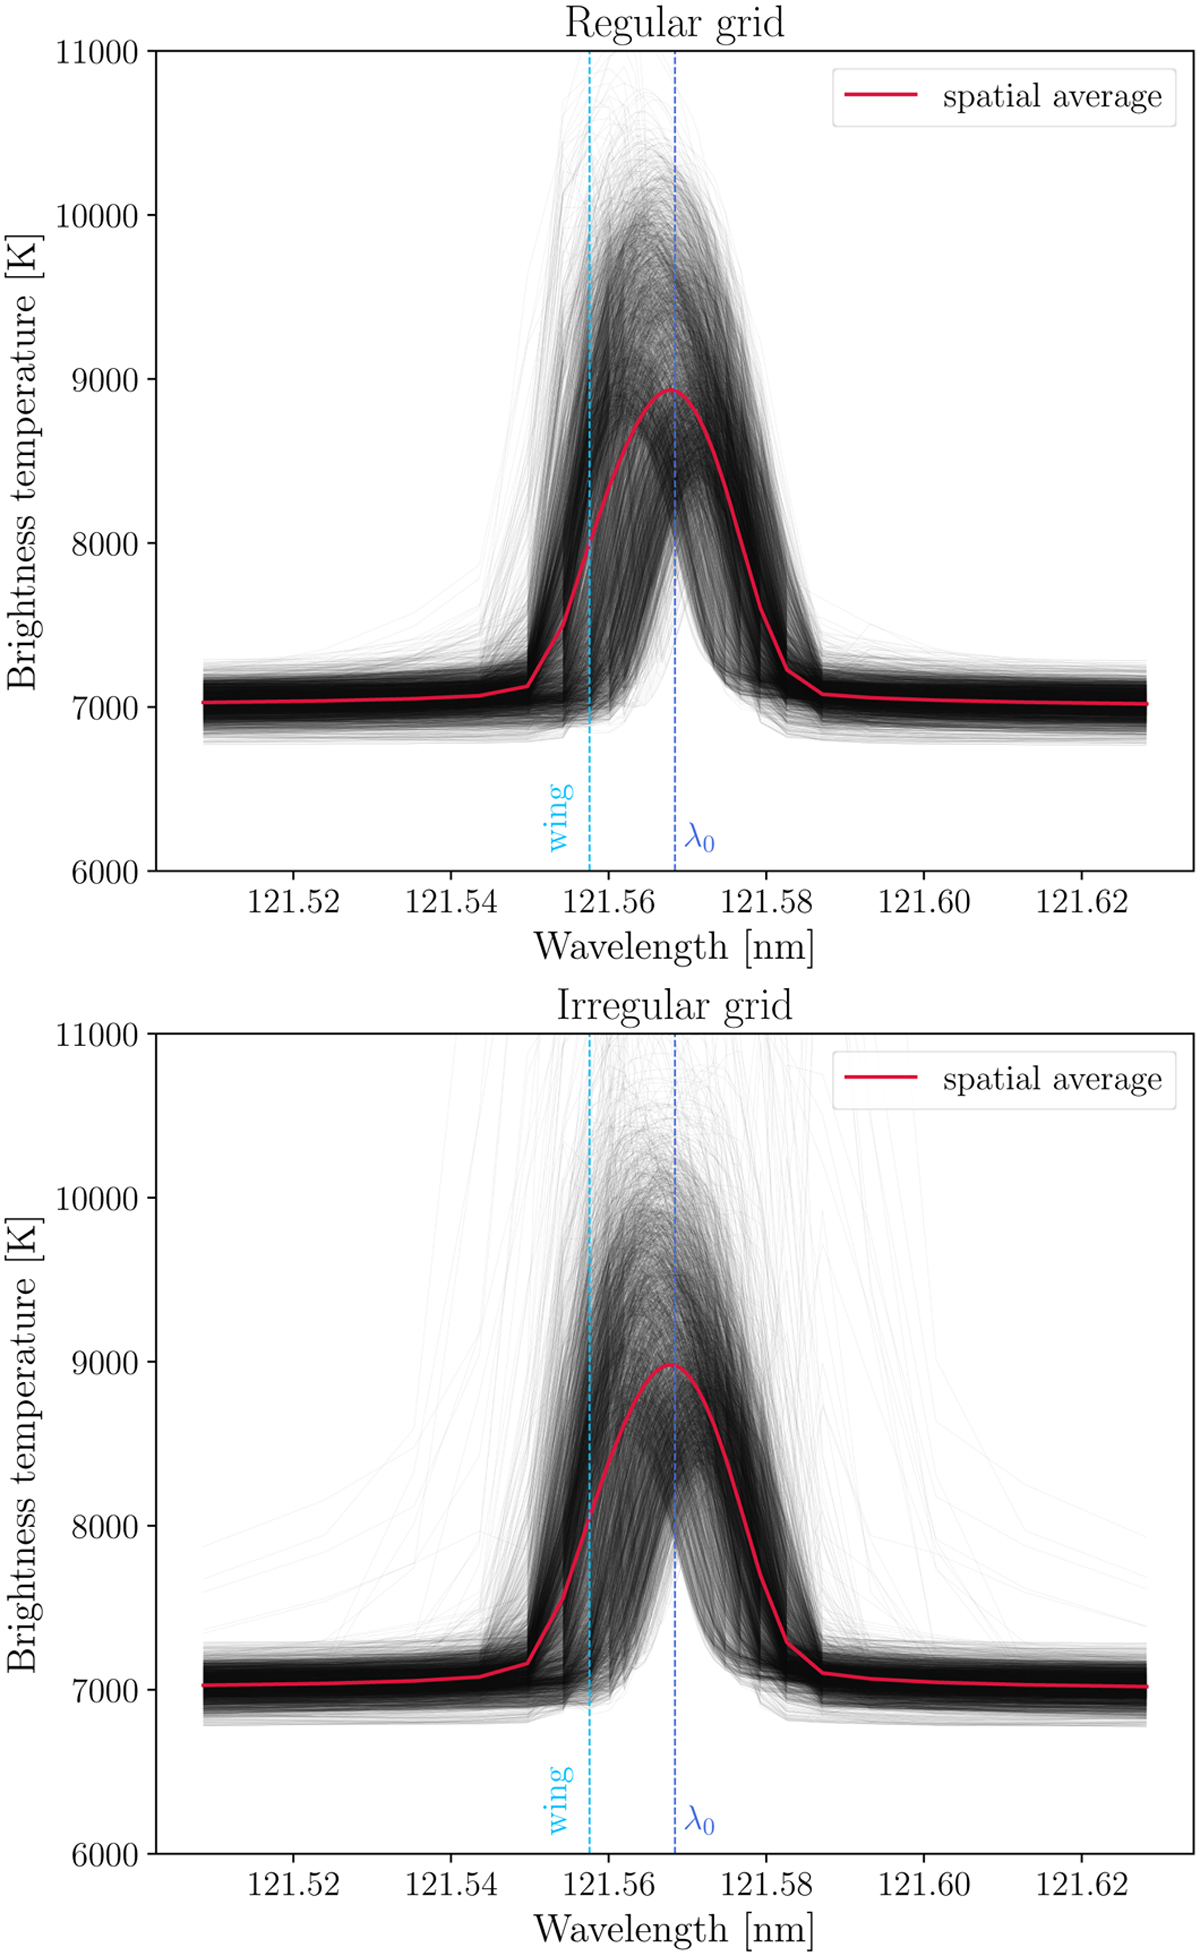
Individual line profiles for the disk-centre intensity calculated from the half-resolution regular grid and an irregular grid with three million sites sampled from log(NH)−2T−2/5. Every black line corresponds to the brightness temperature from a column in the atmosphere. The spatial average over all columns is represented by the red line. The dashed blue lines indicate the wavelength positions of the blue wing at 121.558 nm (or −27 kms−1) and line centre λ0 at 121.568 nm.
Current usage metrics show cumulative count of Article Views (full-text article views including HTML views, PDF and ePub downloads, according to the available data) and Abstracts Views on Vision4Press platform.
Data correspond to usage on the plateform after 2015. The current usage metrics is available 48-96 hours after online publication and is updated daily on week days.
Initial download of the metrics may take a while.


