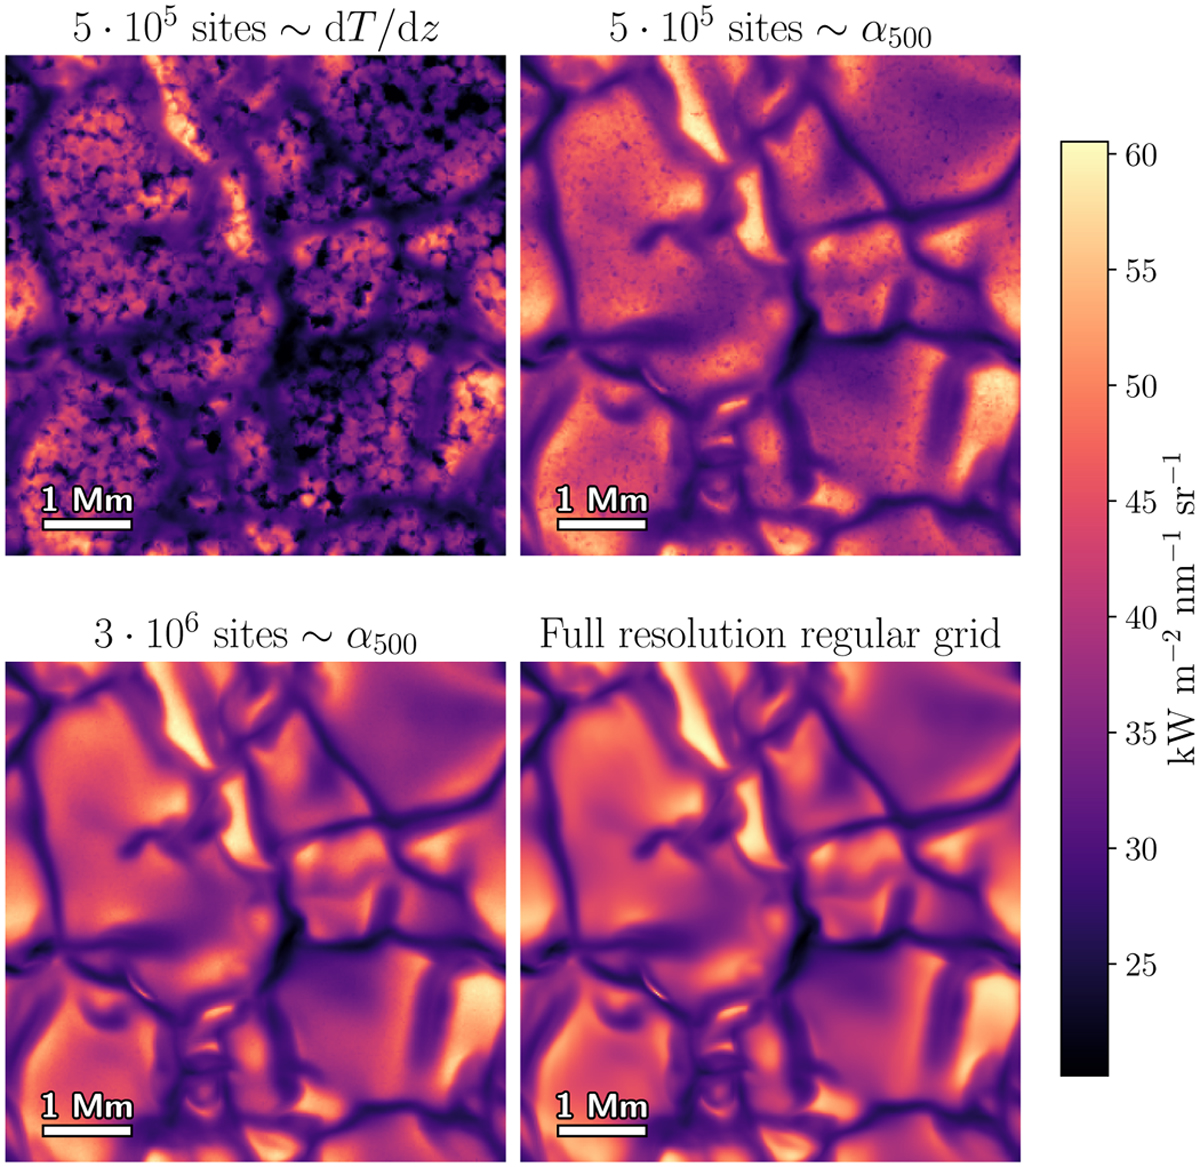
Fig. 5

Download original image
Disk-centre continuum intensity at 500 nm from the Bifrost simulation. Each panel was computed using a different grid. The bottom right panel shows the regular grid, and the other three panels show irregular grids with a different number of sites and constructed sampling distributions of dT/dz and α500, the continuum extinction at 500 nm. All calculations assumed LTE.
Current usage metrics show cumulative count of Article Views (full-text article views including HTML views, PDF and ePub downloads, according to the available data) and Abstracts Views on Vision4Press platform.
Data correspond to usage on the plateform after 2015. The current usage metrics is available 48-96 hours after online publication and is updated daily on week days.
Initial download of the metrics may take a while.


