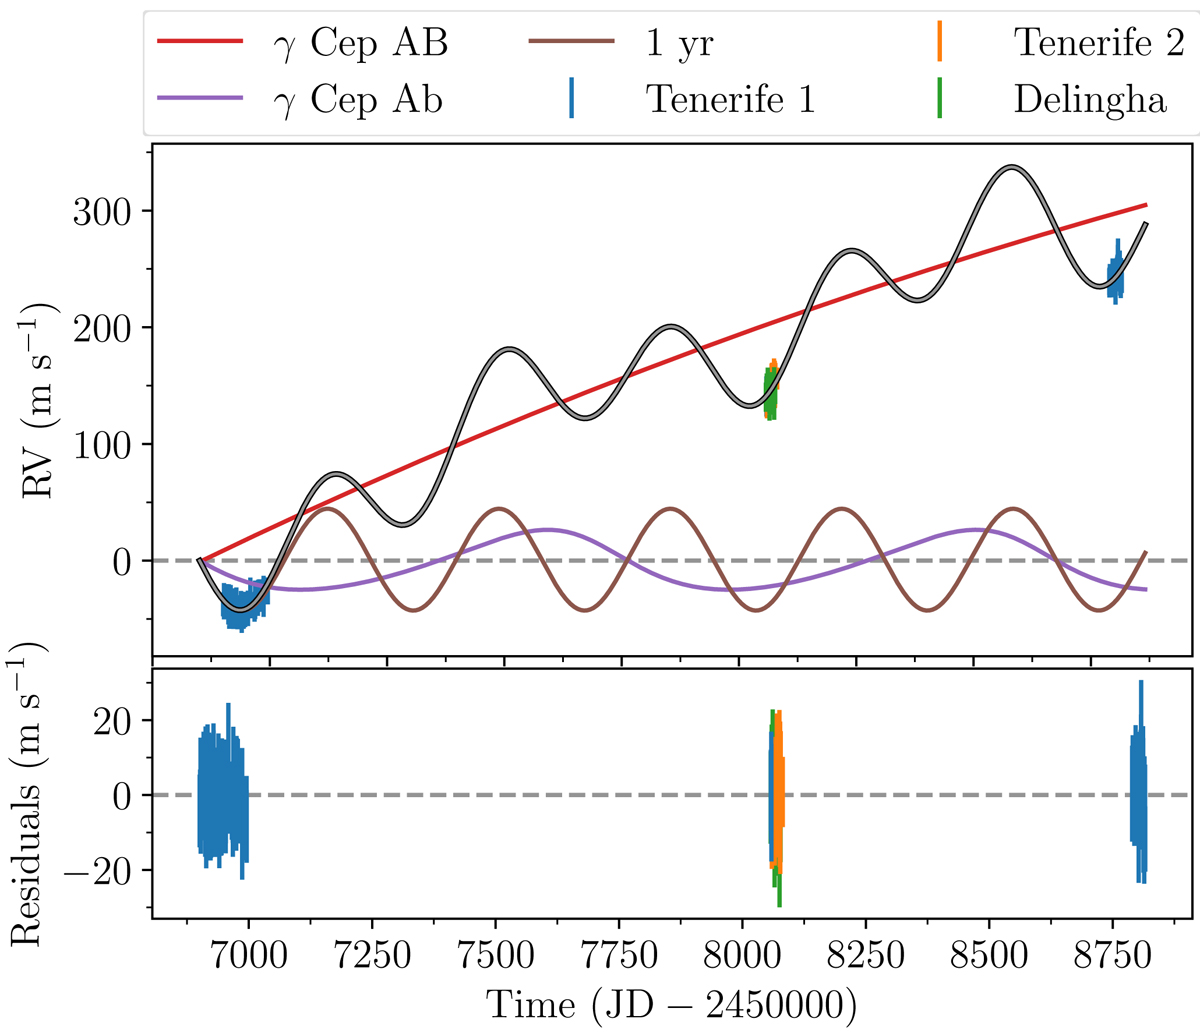
Fig. 9.
Download original image
Orbital motion. Top: Two Keplerian orbits from γ Cep B and γ Cep Ab shown in red and purple, respectively, and the 1 yr signal shown as the brown curve. The sum of the signals is shown as the grey model. Here they have all been shifted to start at 0.0 to make it easier to compare them. The Tenerife data are shown in blue and orange, and the Delingha data are shown in green. Bottom: Residuals after subtracting the model.
Current usage metrics show cumulative count of Article Views (full-text article views including HTML views, PDF and ePub downloads, according to the available data) and Abstracts Views on Vision4Press platform.
Data correspond to usage on the plateform after 2015. The current usage metrics is available 48-96 hours after online publication and is updated daily on week days.
Initial download of the metrics may take a while.