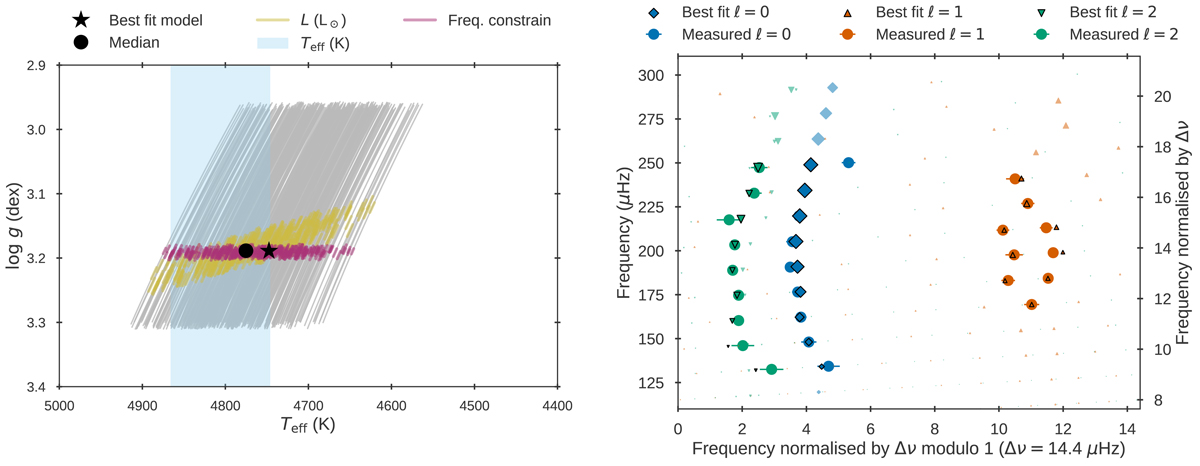
Fig. 7.
Download original image
BASTA Kiel and échelle diagrams. Left: Kiel diagram showing the model grid in grey, with the best fitting and median values denoted by a star and circle, respectively. The constraints applied for the effective temperature, luminosity, and frequencies are shown as the blue, yellow, and magenta shaded ares, respectively. Right: Échelle diagram showing our measured l = 0 (blue), l = 1 (orange), and l = 2 (green) frequencies as circles with error bars compared to our model frequencies from BASTA, shown with black outlines. Transparent markers with no black outline denote frequencies we have not detected. As in Fig. 6, marker sizes show the expected relative amplitude of the modes.
Current usage metrics show cumulative count of Article Views (full-text article views including HTML views, PDF and ePub downloads, according to the available data) and Abstracts Views on Vision4Press platform.
Data correspond to usage on the plateform after 2015. The current usage metrics is available 48-96 hours after online publication and is updated daily on week days.
Initial download of the metrics may take a while.