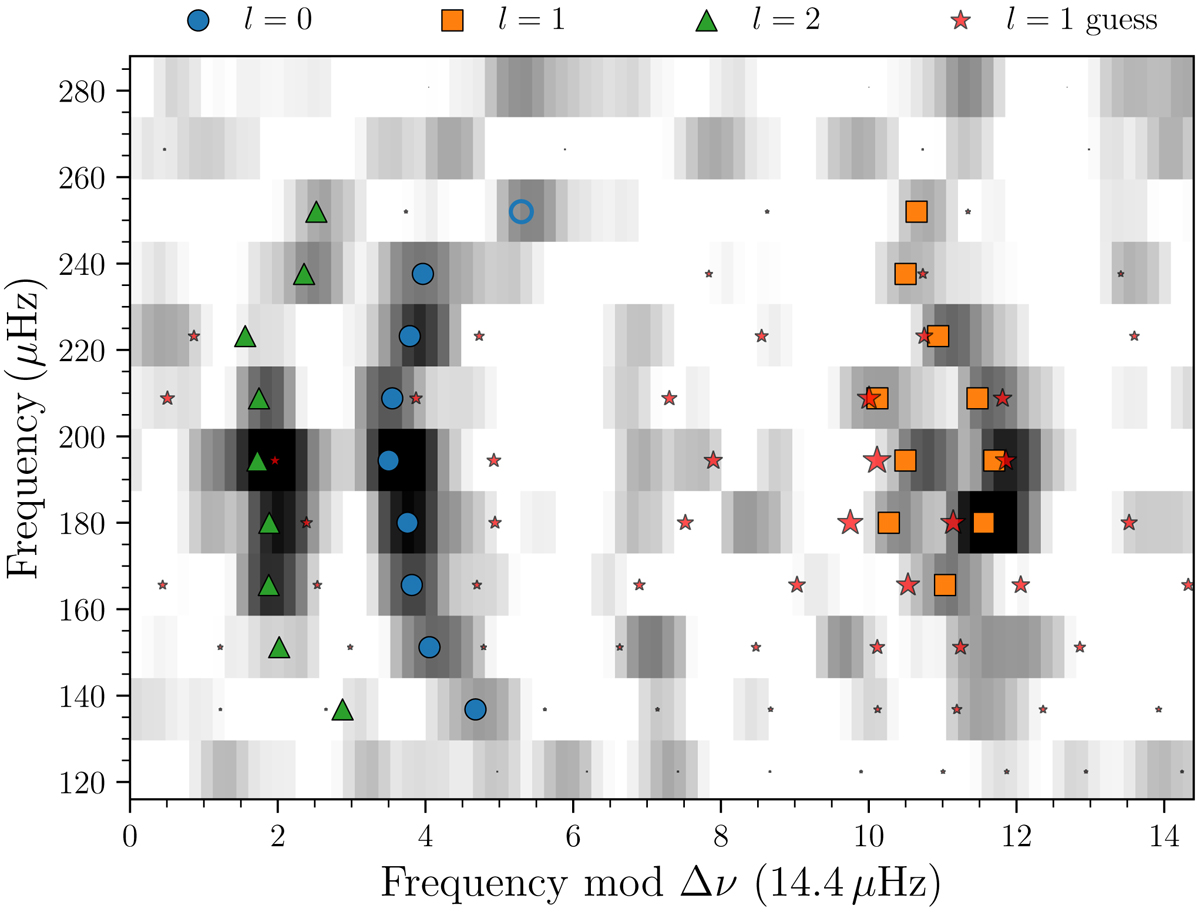
Fig. 6.
Download original image
Échelle diagram of the smoothed (black) spectrum in Fig. 5. The markers indicate the extracted modes. The red stars give the frequencies estimated from the asymptotic mixed-mode relation, with their size showing the expected relative amplitude of the modes. The empty marker indicate the fitted l = 0 that we suspect is not a bona fide mode.
Current usage metrics show cumulative count of Article Views (full-text article views including HTML views, PDF and ePub downloads, according to the available data) and Abstracts Views on Vision4Press platform.
Data correspond to usage on the plateform after 2015. The current usage metrics is available 48-96 hours after online publication and is updated daily on week days.
Initial download of the metrics may take a while.