Open Access
Fig. 2.
Download original image
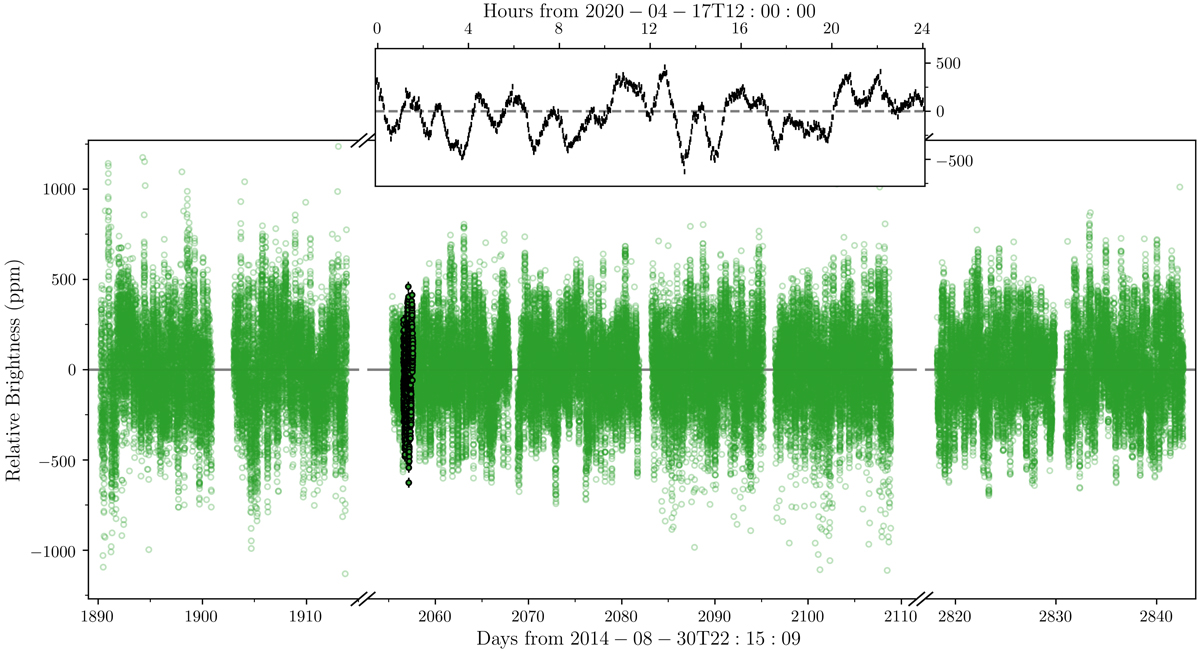
Light curve of γ Cep as observed by TESS in Sectors 18, 24, 25, and 52. Here we have removed outliers and normalised the light curve as described in Sect. 3.1. The error bars in the inset show a 24 h interval. The data shown in the inset are highlighted in the main plot as green circles with black edges and error bars.
Current usage metrics show cumulative count of Article Views (full-text article views including HTML views, PDF and ePub downloads, according to the available data) and Abstracts Views on Vision4Press platform.
Data correspond to usage on the plateform after 2015. The current usage metrics is available 48-96 hours after online publication and is updated daily on week days.
Initial download of the metrics may take a while.