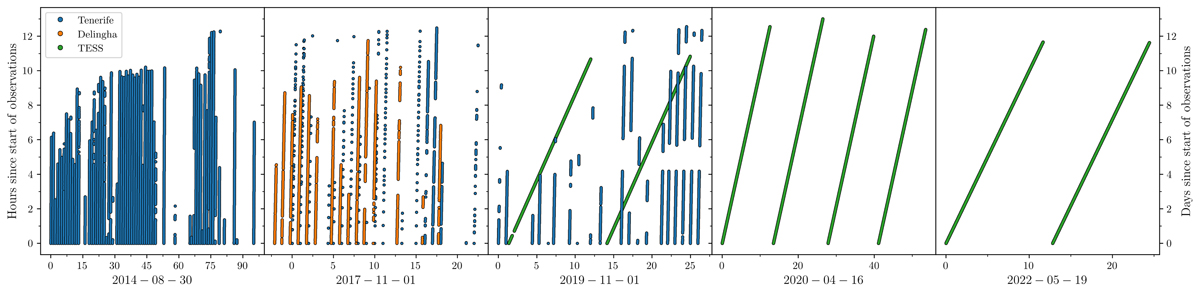
Fig. A.1.
Download original image
Timestamp-mod-timestamp plot. In the first three panels we show the different SONG campaigns of γ Cep, where we have divided each dataset into 24 hr intervals and have plotted these intervals (in hours) against the time from the start of that campaign. The blue points are data from the Tenerife node, and the orange points are data from the Delingha node. In the two last panels we have plotted the TESS data as green points, where this time we have divided the data into intervals of 13.7 d (i.e. the orbital period of TESS), and again we have plotted these intervals (in days) against the start of a campaign. In panel three, the start of the campaign is taken to be the start of the SONG campaign, clearly showing the overlap between the 2019 SONG and TESS data, whereas the start of the campaign (covering two sectors) in the last panel is taken as the start of sector 24.
Current usage metrics show cumulative count of Article Views (full-text article views including HTML views, PDF and ePub downloads, according to the available data) and Abstracts Views on Vision4Press platform.
Data correspond to usage on the plateform after 2015. The current usage metrics is available 48-96 hours after online publication and is updated daily on week days.
Initial download of the metrics may take a while.