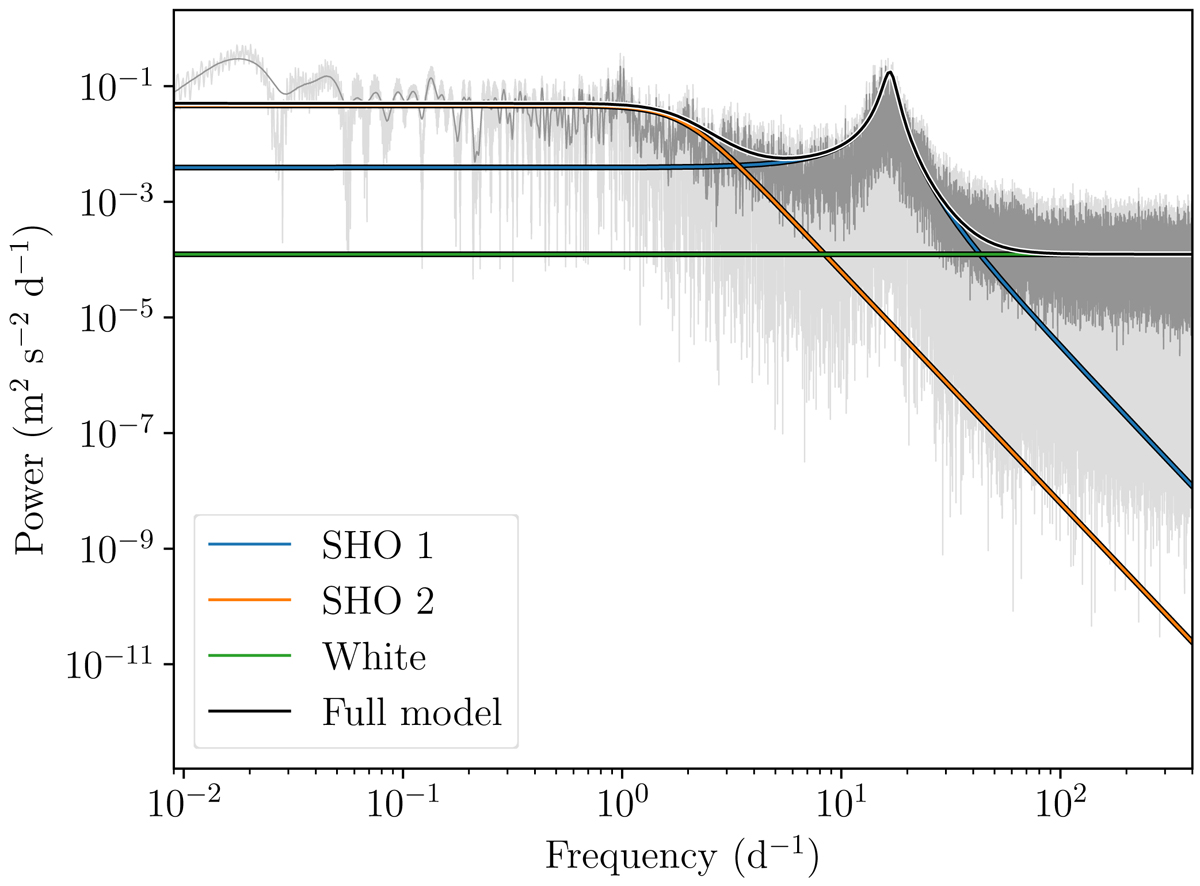
Fig. 11.
Download original image
RV GP power spectrum. The power spectrum of our GP model (black) is compared to the observed power spectrum (light grey) from our RVs after subtracting the orbital motion and 1 yr signal (Fig. 9, bottom). In darker grey we show the observed power spectrum smoothed with a box kernel. The orange and blue curves show our harmonic GP terms, while the green line shows our white noise term.
Current usage metrics show cumulative count of Article Views (full-text article views including HTML views, PDF and ePub downloads, according to the available data) and Abstracts Views on Vision4Press platform.
Data correspond to usage on the plateform after 2015. The current usage metrics is available 48-96 hours after online publication and is updated daily on week days.
Initial download of the metrics may take a while.