Open Access
Fig. 1.
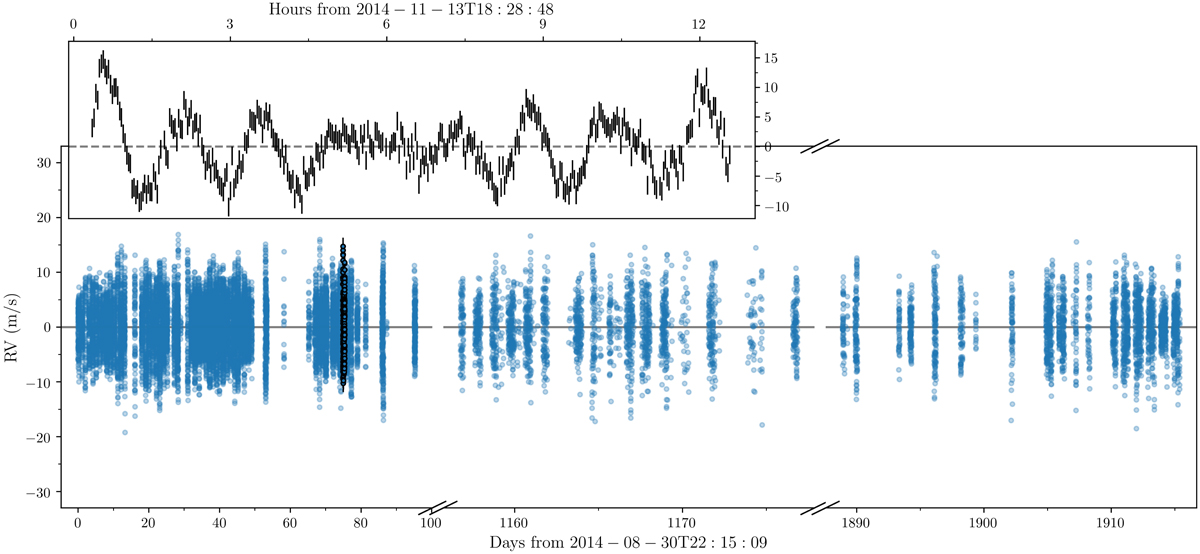
Download original image
Three different seismic SONG campaigns of γ Cep after filtering and subtracting a nightly median (Sect. 3.1). The error bars in the inset represent one night of observations from the 2014 campaign. The data from the inset are displayed in the main plot as blue circles with black edges and error bars.
Current usage metrics show cumulative count of Article Views (full-text article views including HTML views, PDF and ePub downloads, according to the available data) and Abstracts Views on Vision4Press platform.
Data correspond to usage on the plateform after 2015. The current usage metrics is available 48-96 hours after online publication and is updated daily on week days.
Initial download of the metrics may take a while.