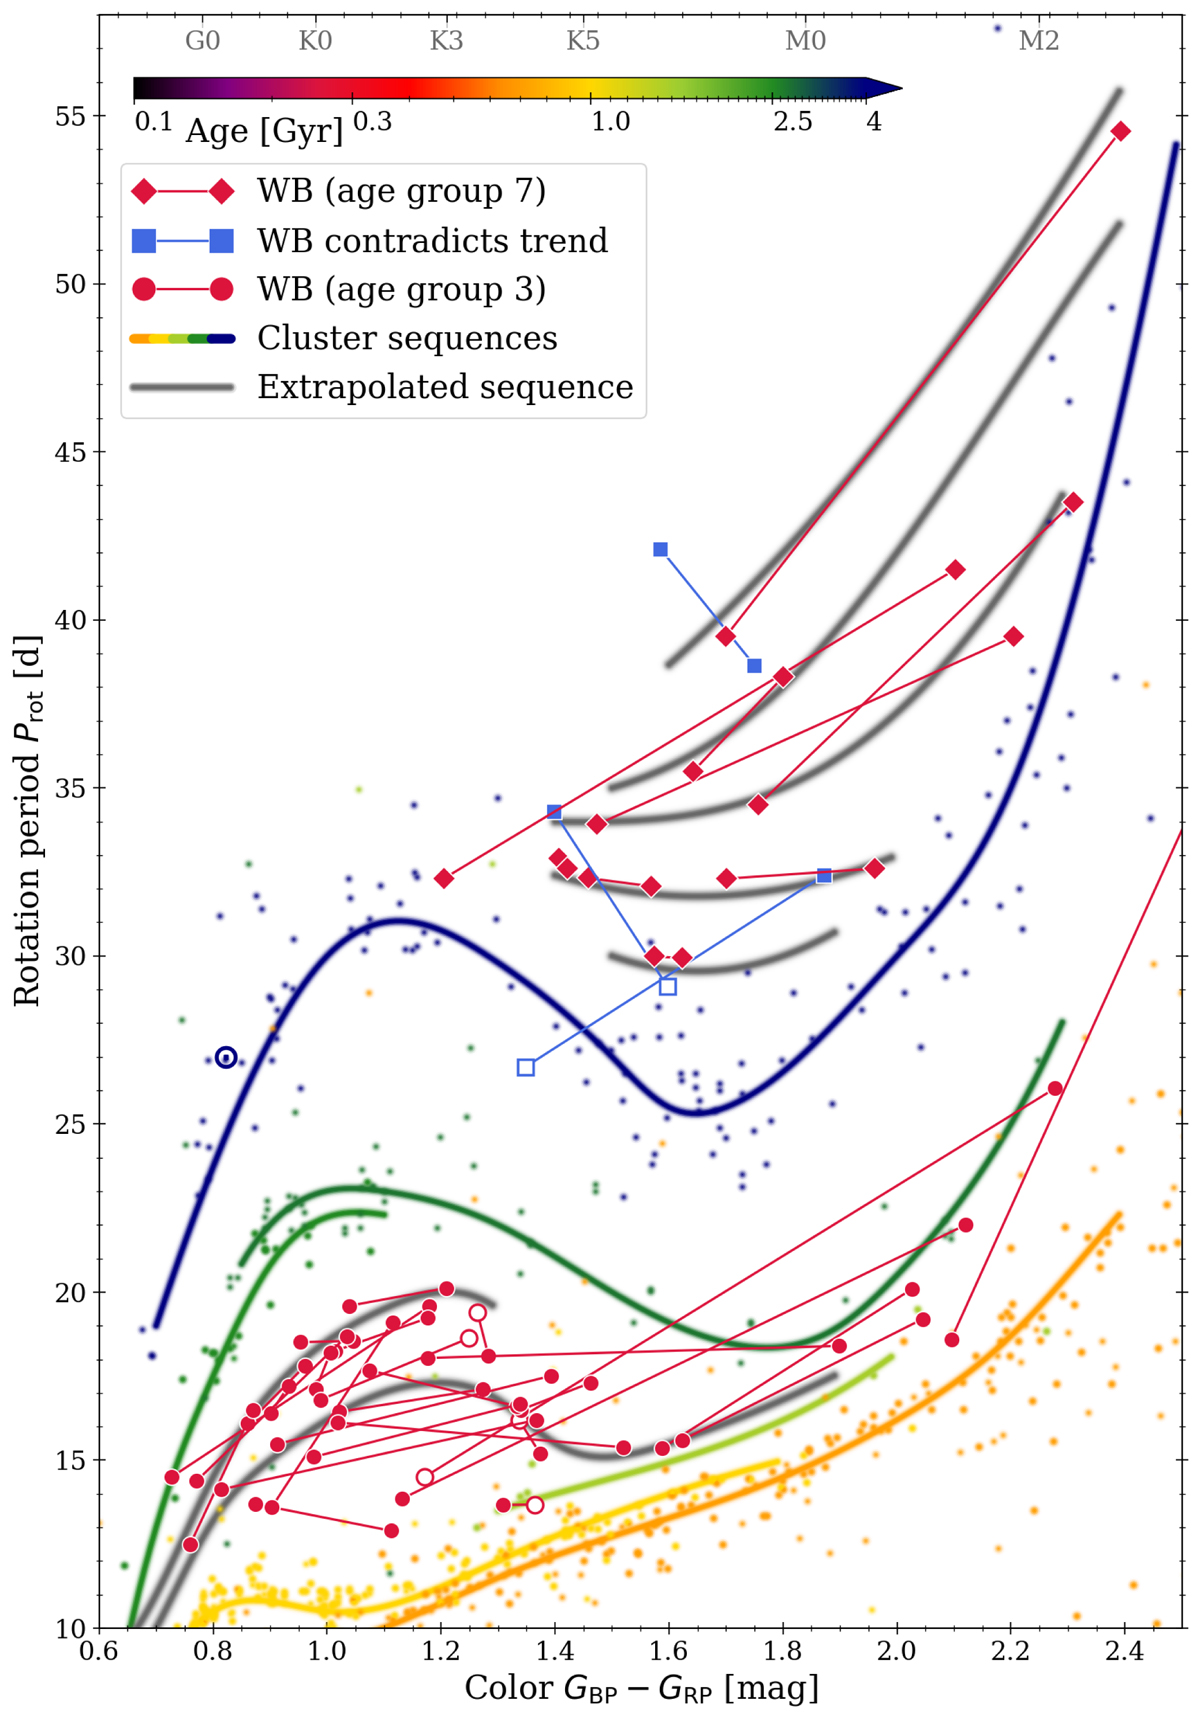
Fig. 8.

Download original image
Color-period diagram showing a possible interpretation of the wide binaries older than 4 Gyr and those with ages 1–2.5 Gyr. The gray lines indicate a best guess extrapolation of the rotation sequences based on the wide binaries (red symbols) and adjacent cluster sequence (colored lines). The Sun is shown with its usual symbol.
Current usage metrics show cumulative count of Article Views (full-text article views including HTML views, PDF and ePub downloads, according to the available data) and Abstracts Views on Vision4Press platform.
Data correspond to usage on the plateform after 2015. The current usage metrics is available 48-96 hours after online publication and is updated daily on week days.
Initial download of the metrics may take a while.


