Fig. 5.
Download original image
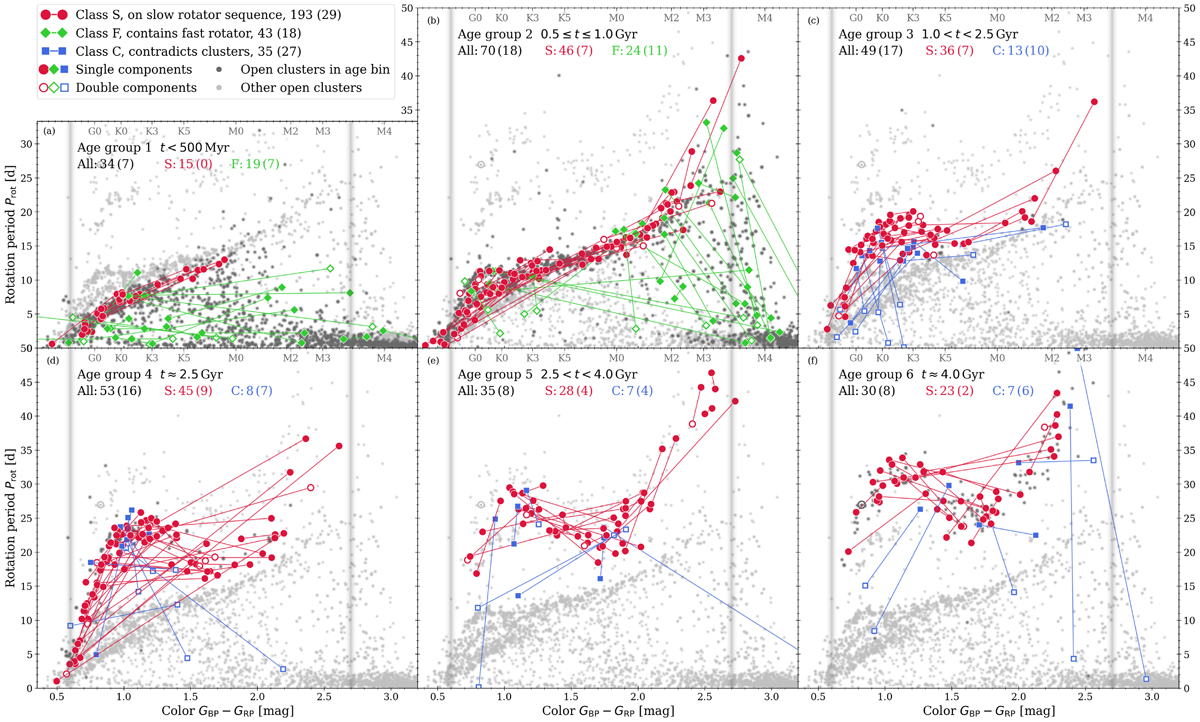
Color-period diagrams for six age groups shown in order of age (left to right, top to bottom). The gray dots are open cluster stars, and cluster stars of the same age group are highlighted. Components of wide binaries are connected by lines and overplotted. Red circles indicate those agreeing with the slow rotator sequences (S), green squares are those connecting to a fast rotator (F), and blue boxes are those altogether disagreeing with the cluster behavior (C). Open symbols denote doubles (i.e., wide binary components identified as binaries themselves). Numbers in the upper-left corner of each panel enumerate the binaries in that age group, distinguished by class (see color coding). Numbers in parentheses indicate how many of these are hierarchical (i.e., where a component itself is a binary). The Sun is shown with its usual symbol. As in Fig. 2, vertical gray lines indicate the Kraft break and the fully convective boundary.
Current usage metrics show cumulative count of Article Views (full-text article views including HTML views, PDF and ePub downloads, according to the available data) and Abstracts Views on Vision4Press platform.
Data correspond to usage on the plateform after 2015. The current usage metrics is available 48-96 hours after online publication and is updated daily on week days.
Initial download of the metrics may take a while.