Fig. 4.
Download original image
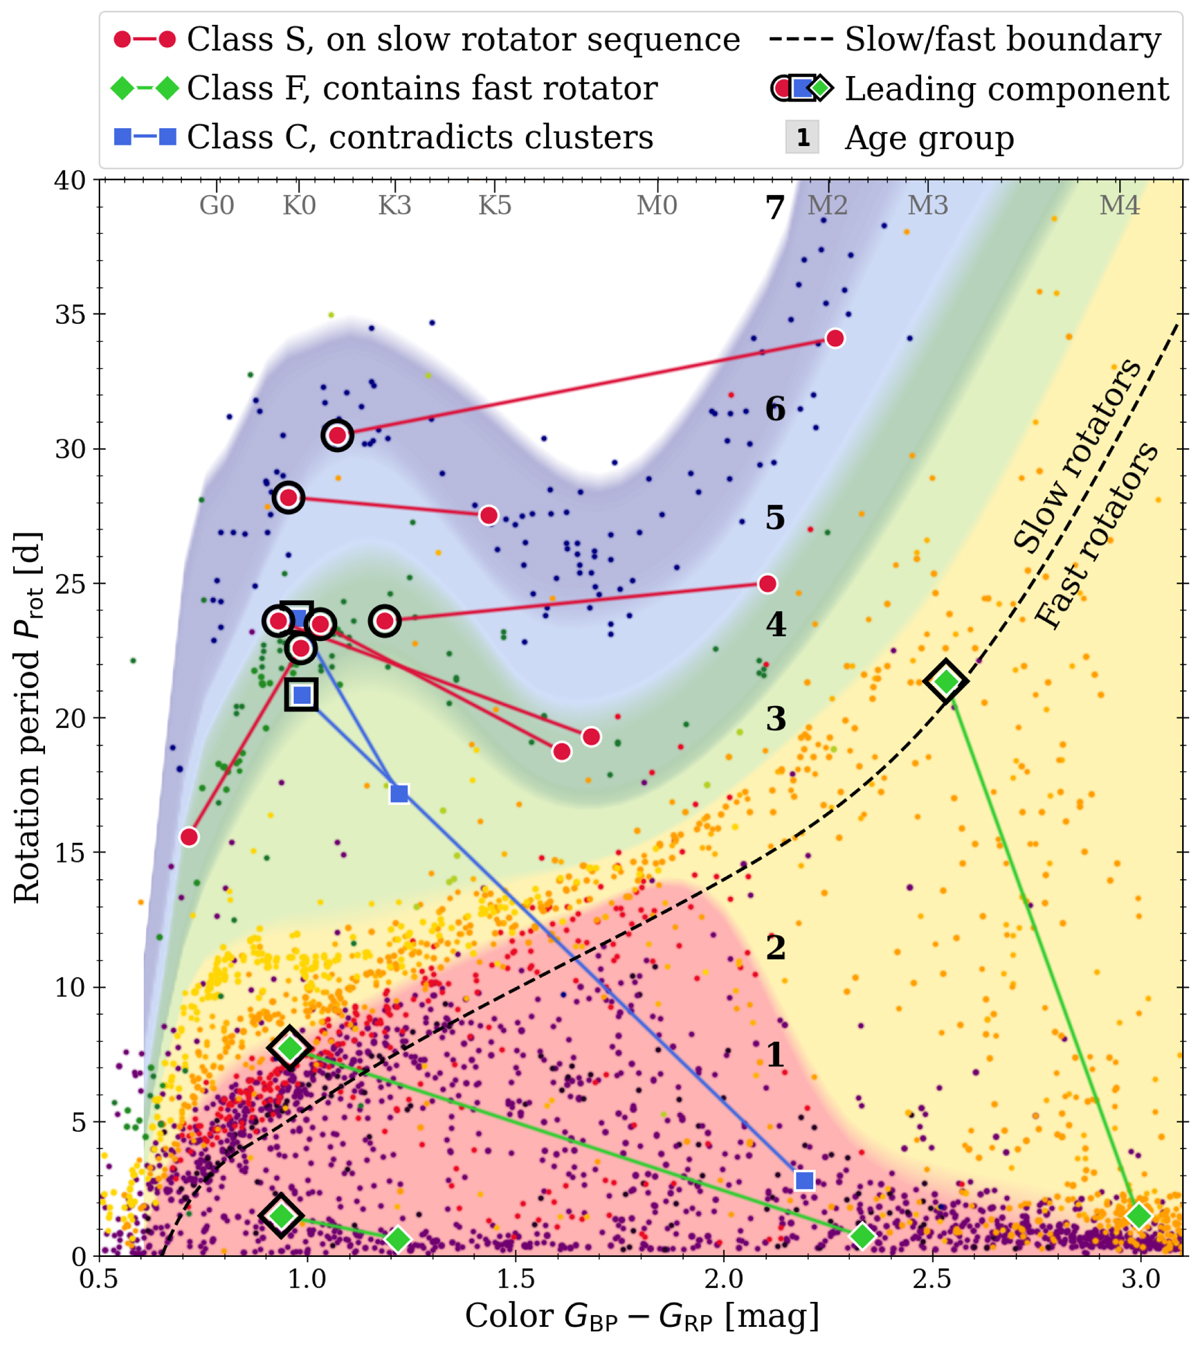
Color-period diagram defining age groups (colored regions) and illustrating the classification of our wide binaries. Color coding roughly follows Fig. 3 and corresponds to the cluster stars plotted in the background (small dots). Age group numbers (1–7) correspond to Table 1. Eleven sample wide binaries are overplotted. Red circles indicate binaries agreeing with the slow rotator sequences, green squares are those containing a fast rotator, and blue boxes mark those altogether disagreeing with the cluster behavior. Stars of each wide binary that were preferentially used to assign them to an age bin (i.e., the L components) are outlined in black. The dashed line denotes the approximate boundary used to distinguish between fast and slow rotators (cf. the sequences indicated in panel b of Fig. 3). The systems plotted are listed in Table C.1.
Current usage metrics show cumulative count of Article Views (full-text article views including HTML views, PDF and ePub downloads, according to the available data) and Abstracts Views on Vision4Press platform.
Data correspond to usage on the plateform after 2015. The current usage metrics is available 48-96 hours after online publication and is updated daily on week days.
Initial download of the metrics may take a while.