Fig. 3.
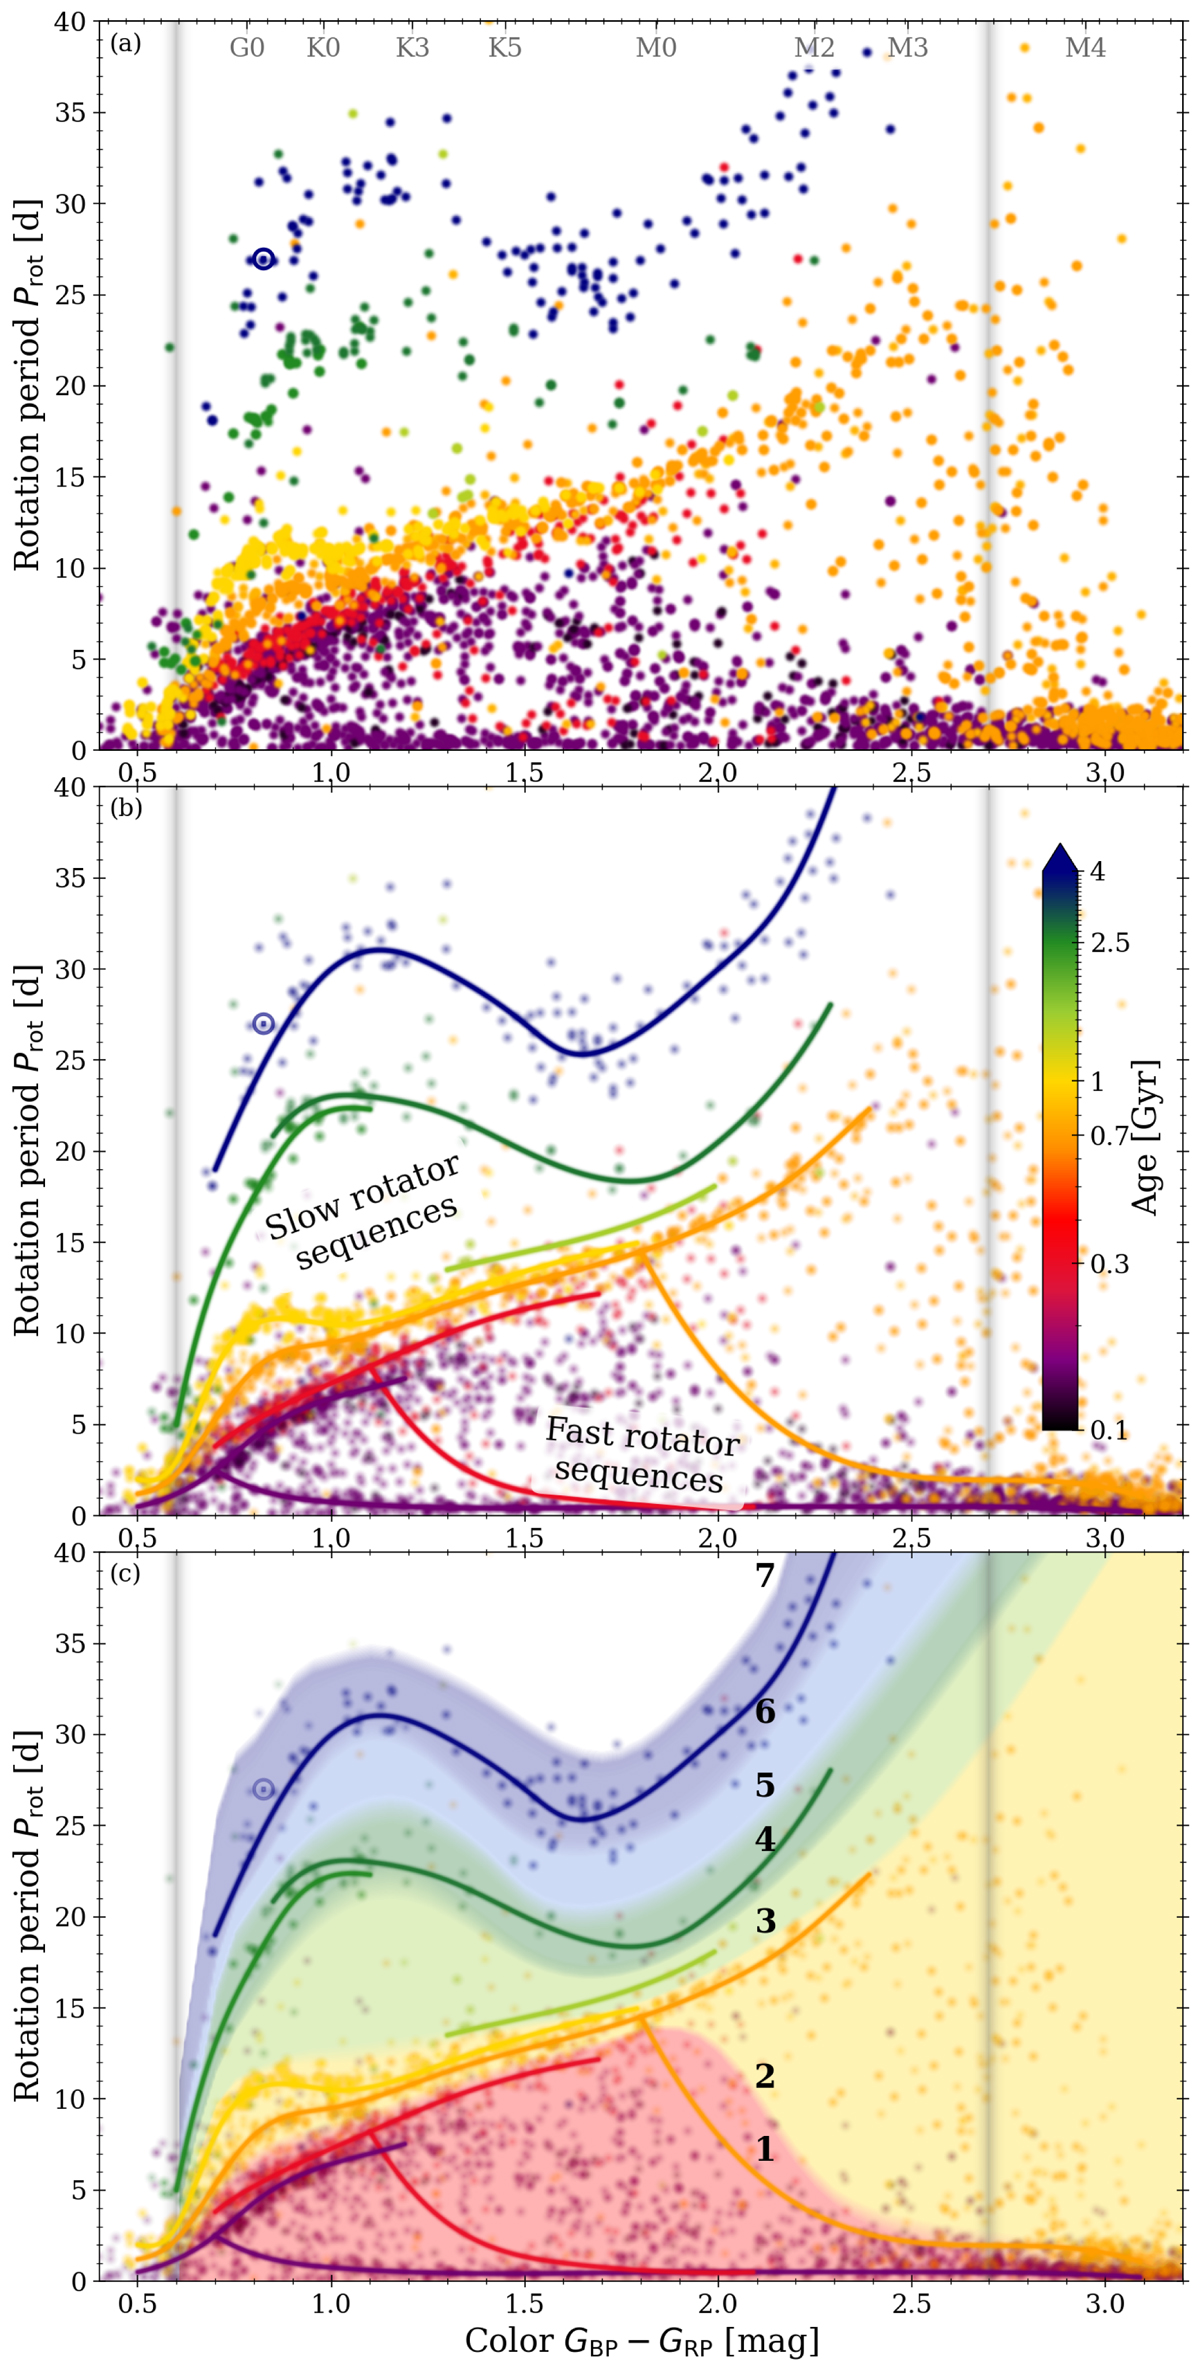
Download original image
Color-period diagrams for our sample of open cluster stars. Panel a: All the stars from our open cluster compilation (cf. Table 1). Panel b: Same stars but overplotted with a manual indication of the sequences followed by stars of the same age (the cluster sequences), with slow and fast rotator sequences where available. Panel c: How cluster sequences and inter-cluster gaps were used to divide the continuous space of the CPD into groups 1–7 (cf. Sect. 2.3). Stars, sequences, and groups are all color coded by age (see color bar in panel b, based on the cluster ages in Table 1). The Sun is shown with its usual symbol. As in Fig. 2, vertical gray lines indicate the Kraft break and the fully convective boundary.
Current usage metrics show cumulative count of Article Views (full-text article views including HTML views, PDF and ePub downloads, according to the available data) and Abstracts Views on Vision4Press platform.
Data correspond to usage on the plateform after 2015. The current usage metrics is available 48-96 hours after online publication and is updated daily on week days.
Initial download of the metrics may take a while.