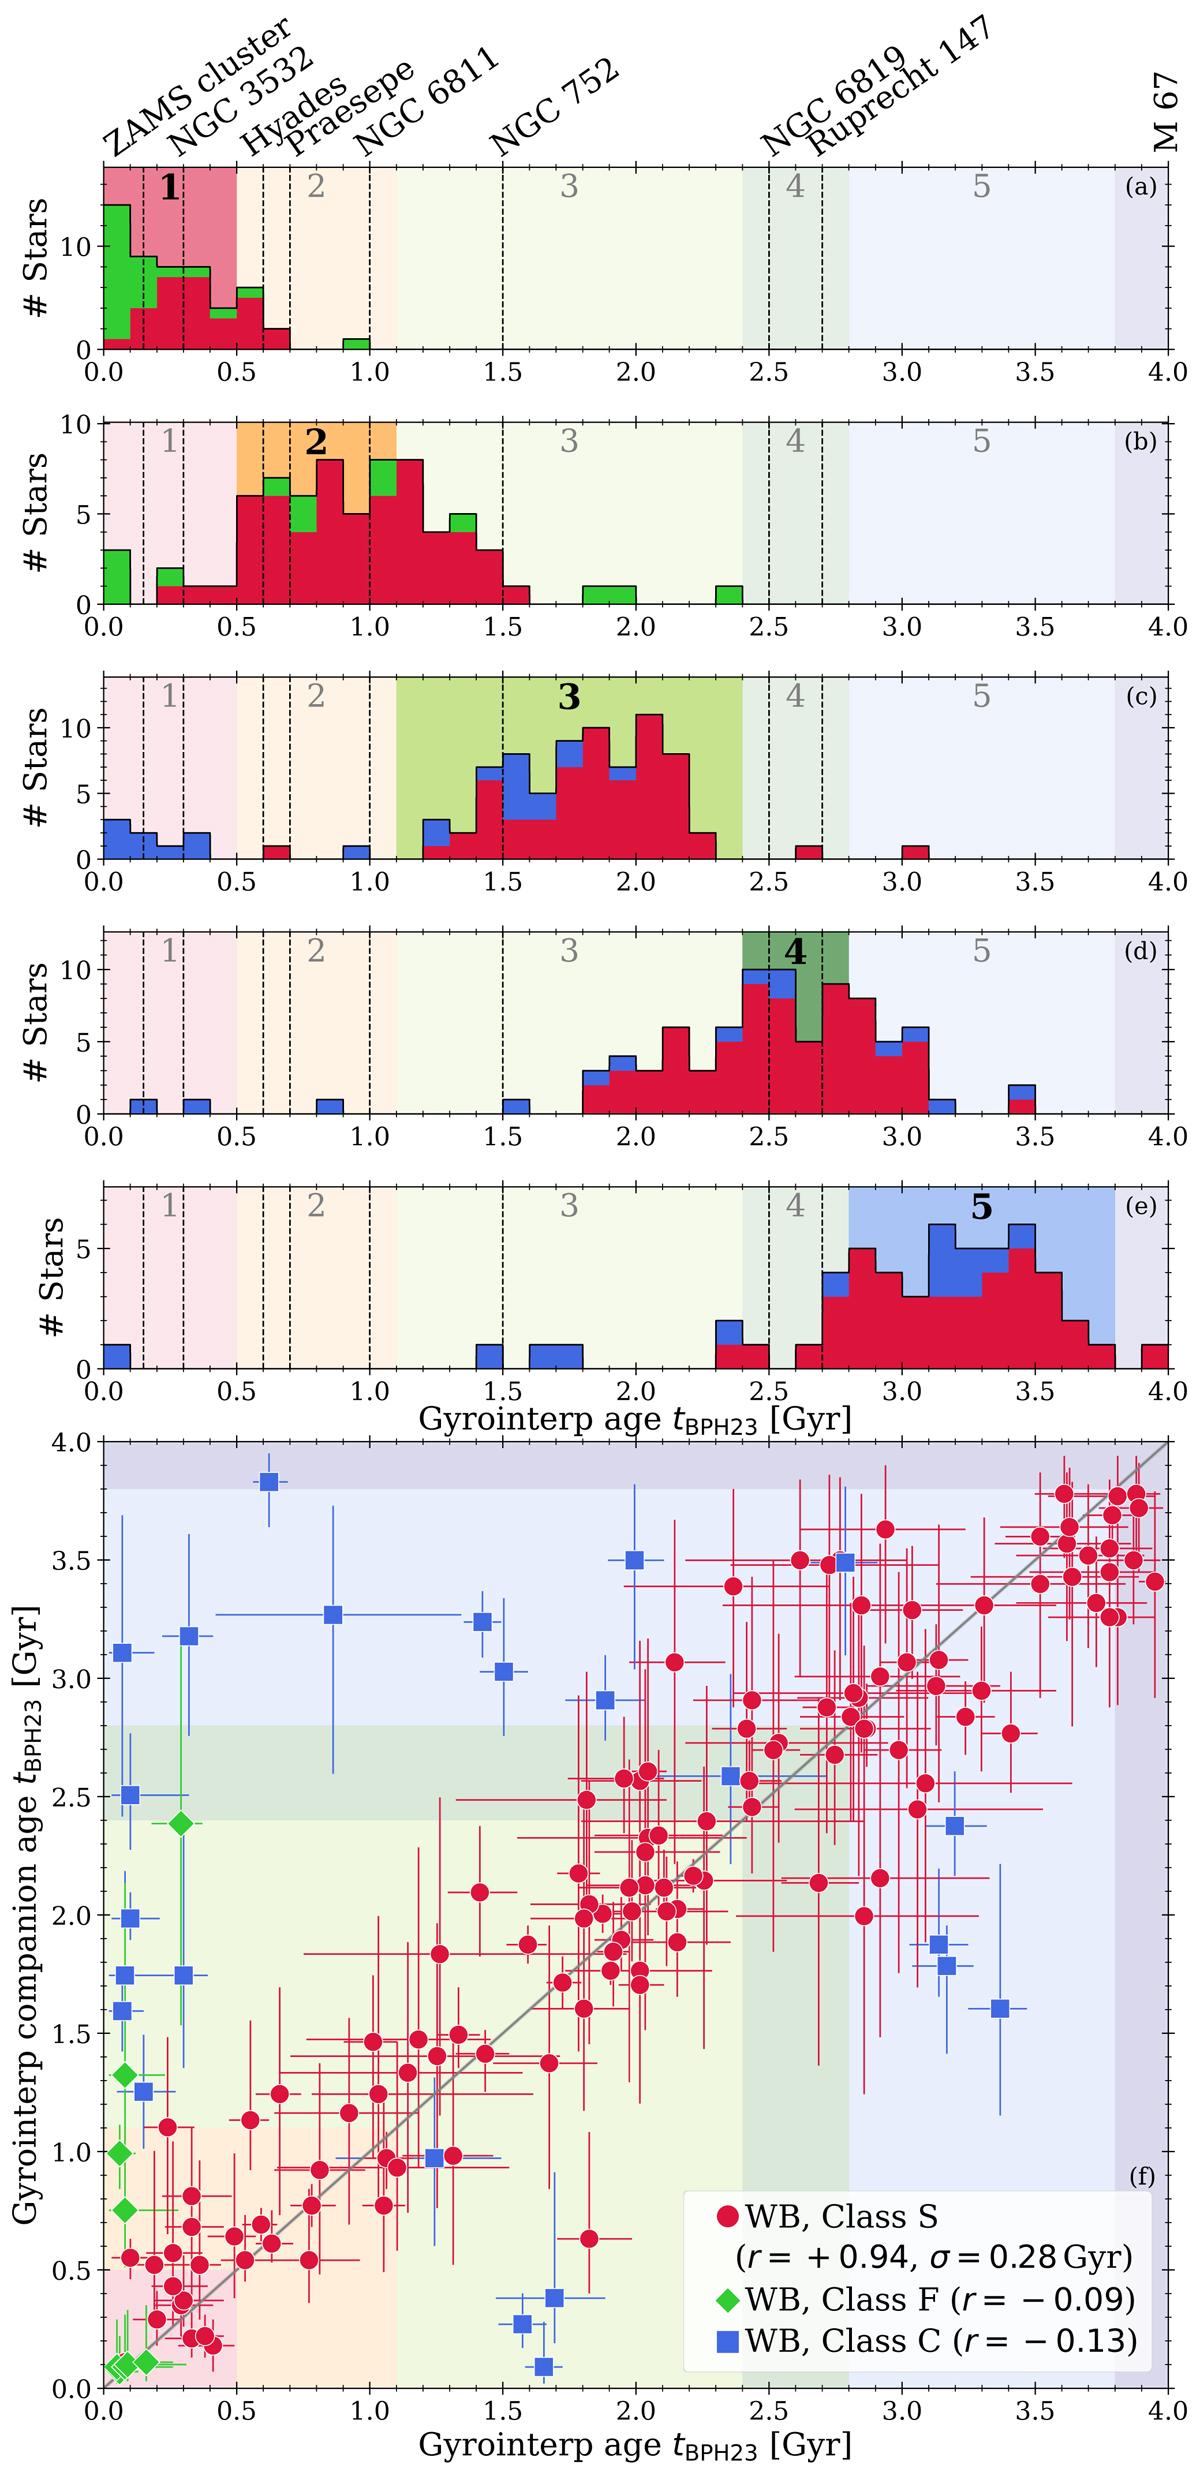
Fig. B.1.
Download original image
Comparison with ages from gyro-interp. Panels (a) to (e) show histograms of the ages sorted into our age groups 1 – 5. The background color coding shows the rough extent of the individual groups, with the relevant one highlighted. Panel (f) shows the age of the wide binary component with a larger age uncertainty against the one with a smaller uncertainty. In all plots, the color coding refers to classification of the wide binary systems.
Current usage metrics show cumulative count of Article Views (full-text article views including HTML views, PDF and ePub downloads, according to the available data) and Abstracts Views on Vision4Press platform.
Data correspond to usage on the plateform after 2015. The current usage metrics is available 48-96 hours after online publication and is updated daily on week days.
Initial download of the metrics may take a while.