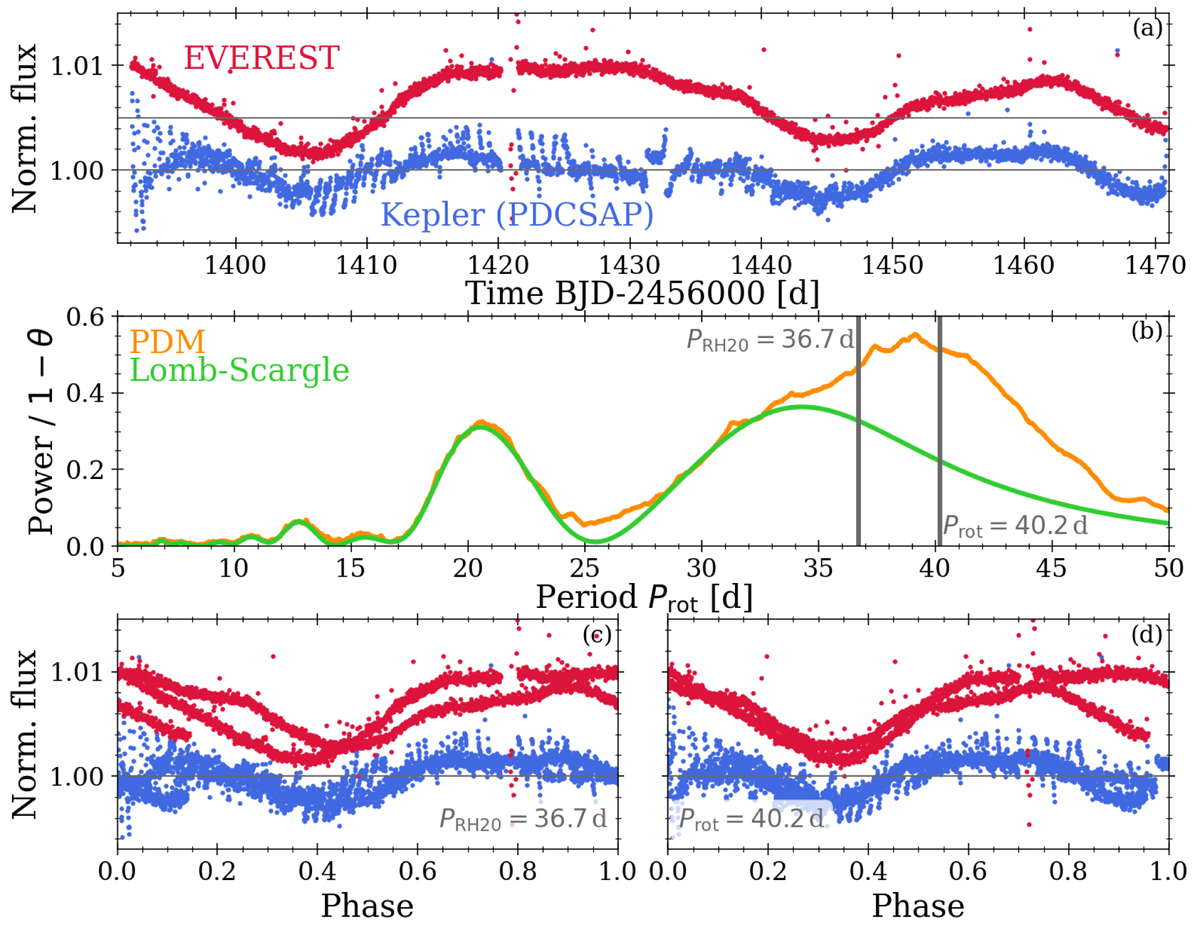
Fig. A.5.
Download original image
Same as Fig. A.4, but for the sample star EPIC 220652177. Panel (a) shows the K2 C08 light curves obtained from the Kepler archive (blue) and Everest (red). The light curves a clear double-dipping signal. The power spectra in panel (b) were calculated from a PDM (orange, displayed as 1 − θ) and a Lomb-Scargle periodogram (green). The rotation periods identified by RH20 (36.7 d) and us (40.2 d) are both indicated. Panels (c) and (d) show phase-folded plots based on RH20 and our period, respectively. In (a), (c), and (d), we have shifted the Everest data vertically by 0.005 units for visibility reasons.
Current usage metrics show cumulative count of Article Views (full-text article views including HTML views, PDF and ePub downloads, according to the available data) and Abstracts Views on Vision4Press platform.
Data correspond to usage on the plateform after 2015. The current usage metrics is available 48-96 hours after online publication and is updated daily on week days.
Initial download of the metrics may take a while.