Fig. A.1.
Download original image
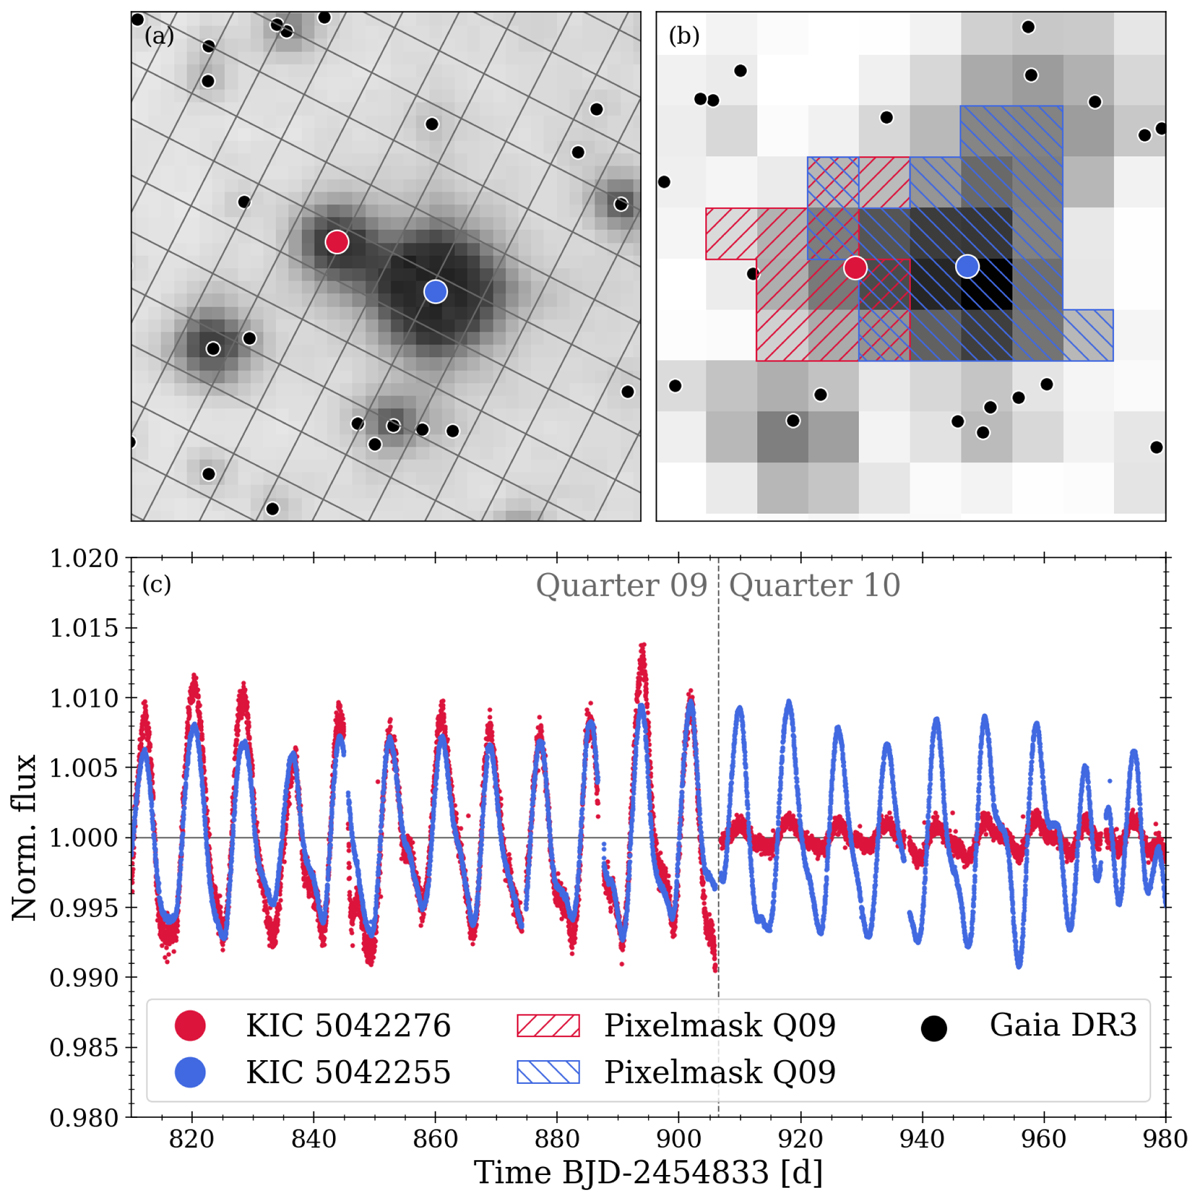
Example of light curve contamination. Panel (a): DSS2 (red) image around one of our wide binaries (KIC; Ids given in the legend of panel c). The positions of the two wide binary stars (red and blue dots) are indicated, along with those of other sources recognized by GDR3. The overlaid grid shows the Kepler pixels that sample the region. Panel (b): Cutout from a Kepler full frame image of the same region (with a somewhat similar orientation and size). The field of view in panels (a) and (b) is about 40″ × 40″. The overplotted hatched areas indicate the pixelmask for Quarter 9 as reported in the auxiliary data to the light curves. Panel (c): Light curves of the component stars. They are focused on the end of Quarter 9 and the beginning of Quarter 10. The similarity in both behaviors is readily visible. The displayed and similar systems were discarded from our sample.
Current usage metrics show cumulative count of Article Views (full-text article views including HTML views, PDF and ePub downloads, according to the available data) and Abstracts Views on Vision4Press platform.
Data correspond to usage on the plateform after 2015. The current usage metrics is available 48-96 hours after online publication and is updated daily on week days.
Initial download of the metrics may take a while.