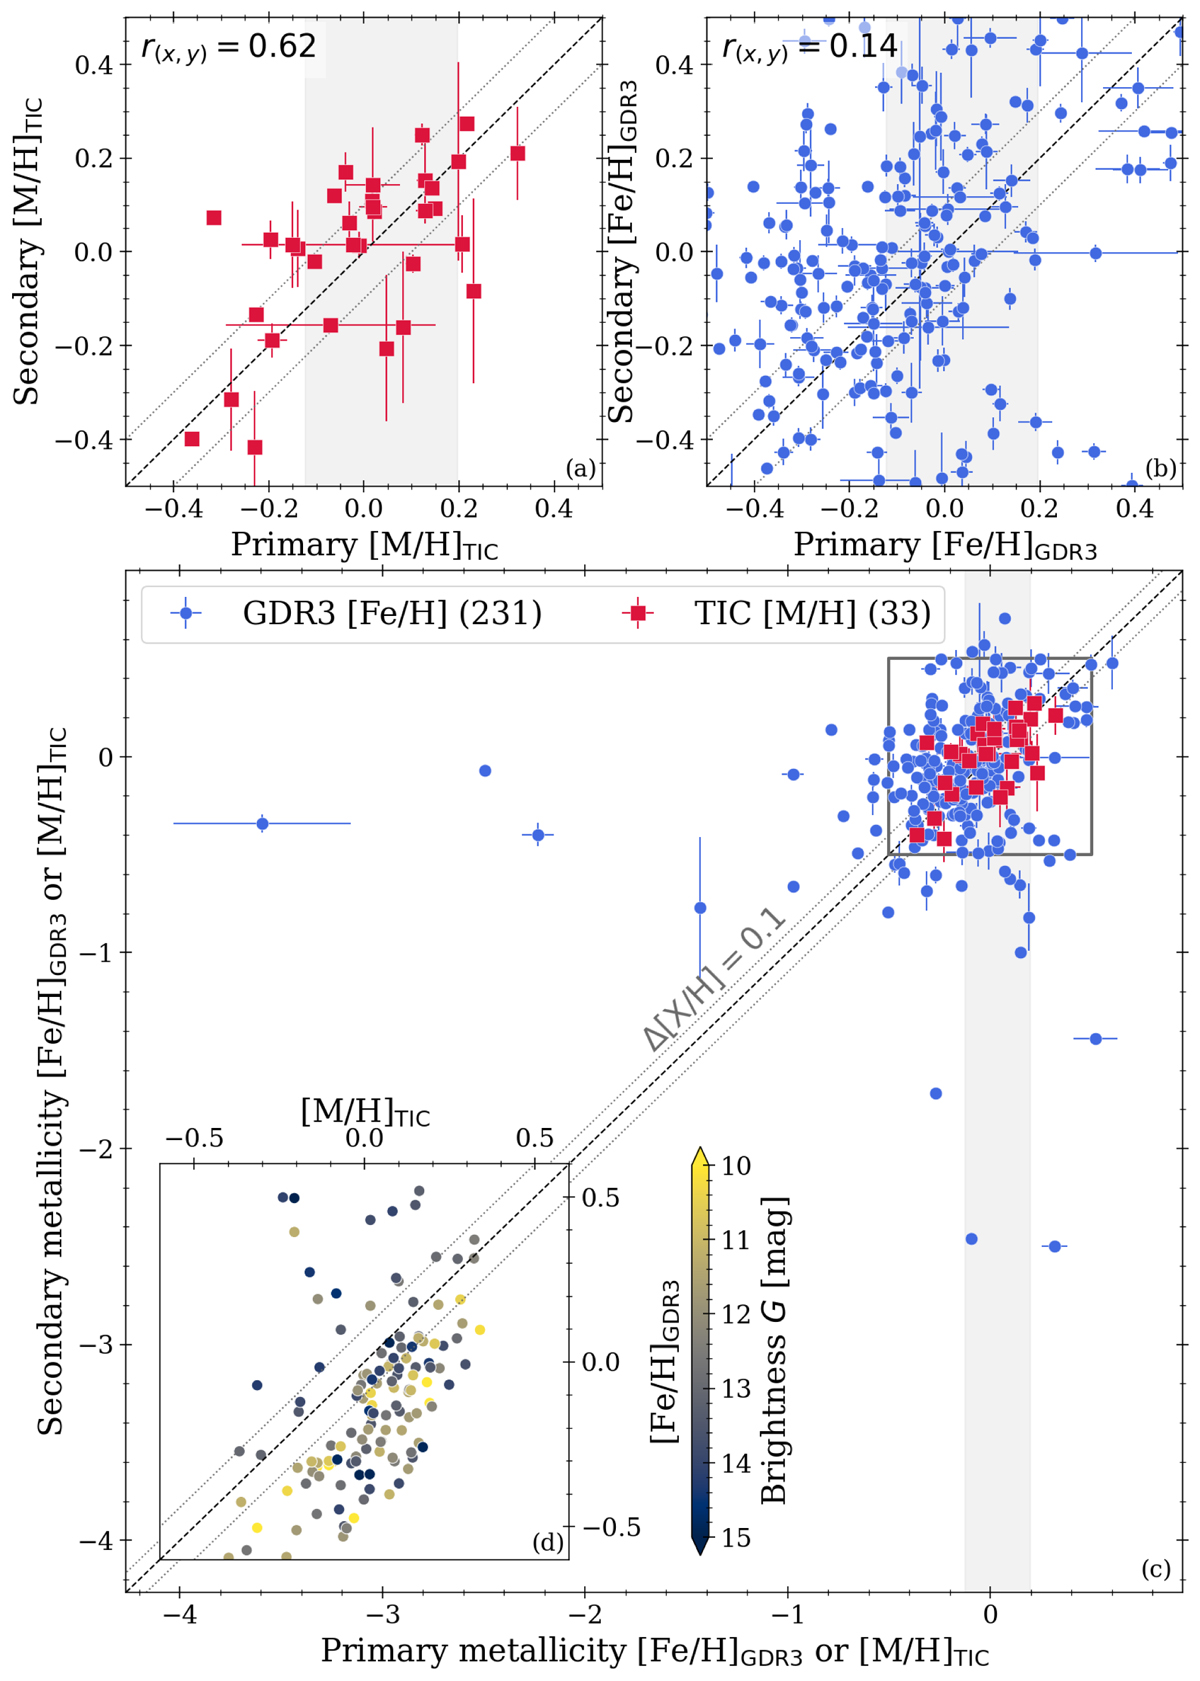
Fig. 12.
Download original image
Comparison between the metallicities of the wide binary components of our wide binary sample, as extracted from GDR3 (blue, [Fe/H]) and TIC (red, [M/H]). The highlighted region indicates the nominal metallicity range covered by the open cluster sample assembled in Table 1. The gray box in panel c indicates the range plotted in panels a and b. Panels a and b display Pearson’s r correlation coefficient (Galton 1877; Pearson 1895) between the primary and secondary’s metallicities. Panel d compares the [Fe/H] and [M/H] measurements for all our sample stars where both are available.
Current usage metrics show cumulative count of Article Views (full-text article views including HTML views, PDF and ePub downloads, according to the available data) and Abstracts Views on Vision4Press platform.
Data correspond to usage on the plateform after 2015. The current usage metrics is available 48-96 hours after online publication and is updated daily on week days.
Initial download of the metrics may take a while.