Fig. 2
Download original image
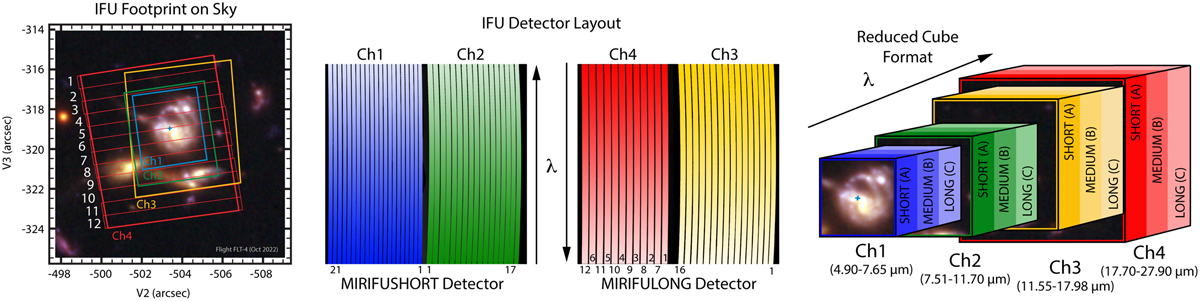
Schematic overview of the MIRI MRS IFU. Left-hand panel: Footprint of the IFUs for channels 1–4 (blue, green, orange, and red regions, respectively) using their “short” grating setting. Individual slices have been drawn and numbered for band 4short. Middle panel: Layout of the dispersed spectra on the two Si:As IBC detector arrays. Slices that are adjacent on the sky are interleaved in the detector plane; numbers illustrate the schematic layout (shown in full for channel 4). Right panel: Composite data cube reconstructed from the dispersed spectra illustrating the wavelength coverage of each of the twelve MRS spectral bands. Since the IFU FOV increases with wavelength, the data cube is in practice akin to a stepped pyramid. The figure is adopted from Law et al. (2023).
Current usage metrics show cumulative count of Article Views (full-text article views including HTML views, PDF and ePub downloads, according to the available data) and Abstracts Views on Vision4Press platform.
Data correspond to usage on the plateform after 2015. The current usage metrics is available 48-96 hours after online publication and is updated daily on week days.
Initial download of the metrics may take a while.