Fig. 16
Download original image
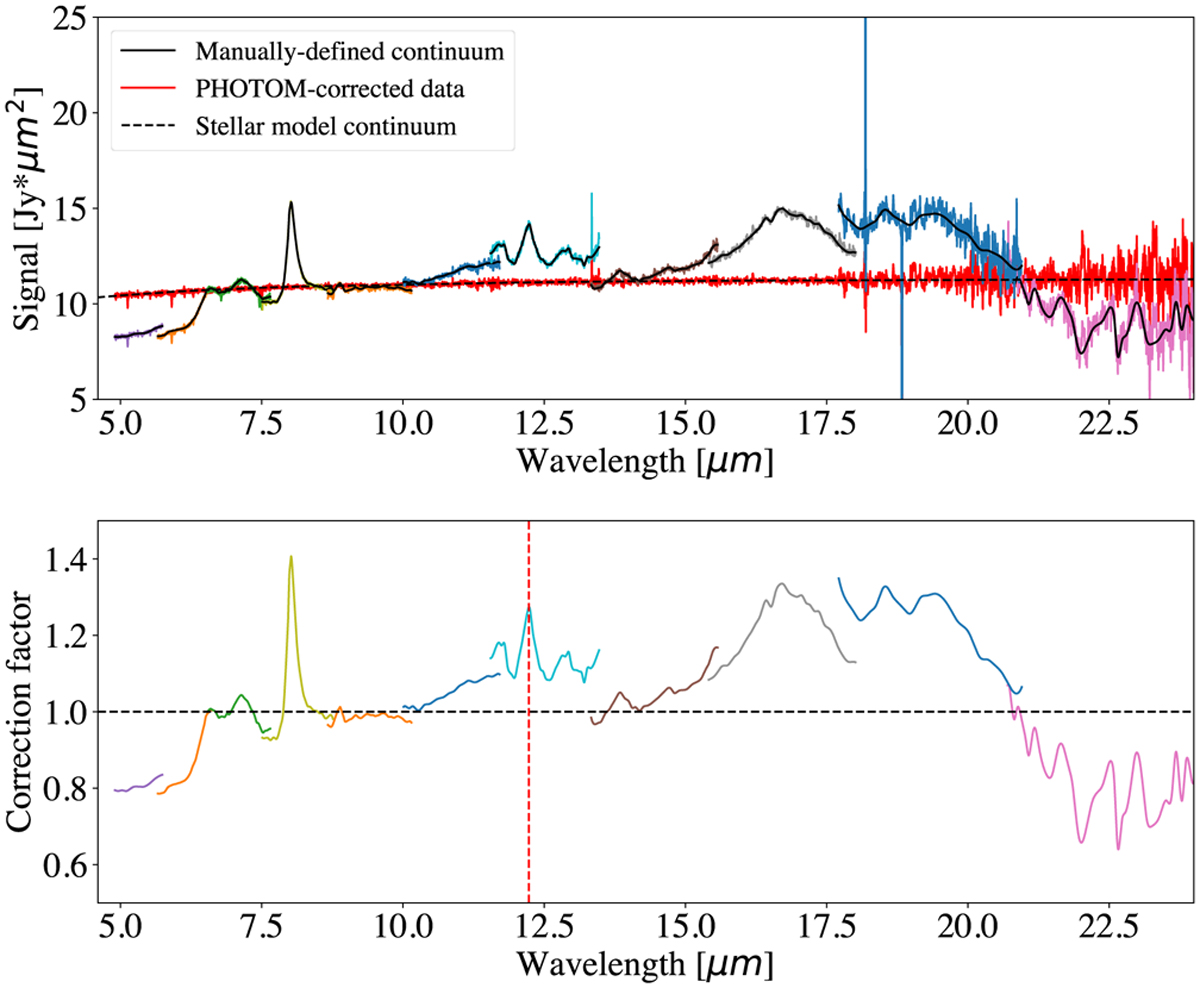
MRS spectro-photometric correction based on flight data. Top: Colored curves showing the MRS point source integrated spectra in different spectral bands for the A-star HD 163466, which were reduced using the ground-based spectro-photometric solution. The spectrum is cut at 23 µm due to the S/N on the source becoming too low beyond that point. A spectral continuum is determined for each spectral band (black solid line). By comparing the manually defined continuum to the theoretical continuum of the A-star, based on Gordon et al. (2022), a 1D spectro-photometric correction vector is derived for each spectral band. After introducing this correction, the A-star data are reduced once more. The resulting spectrum is shown by the red line. Bottom: One-dimensional spectro-photometric correction vectors. The prominent emission feature at 8 µm is an artifact from the MIRI FM ground test campaign. This artifact is corrected in the in-flight spectro-photometric solution. The dotted red line shows the location of the MRS spectral leak at 12.22 µm (see text for further details).
Current usage metrics show cumulative count of Article Views (full-text article views including HTML views, PDF and ePub downloads, according to the available data) and Abstracts Views on Vision4Press platform.
Data correspond to usage on the plateform after 2015. The current usage metrics is available 48-96 hours after online publication and is updated daily on week days.
Initial download of the metrics may take a while.