Fig. 12
Download original image
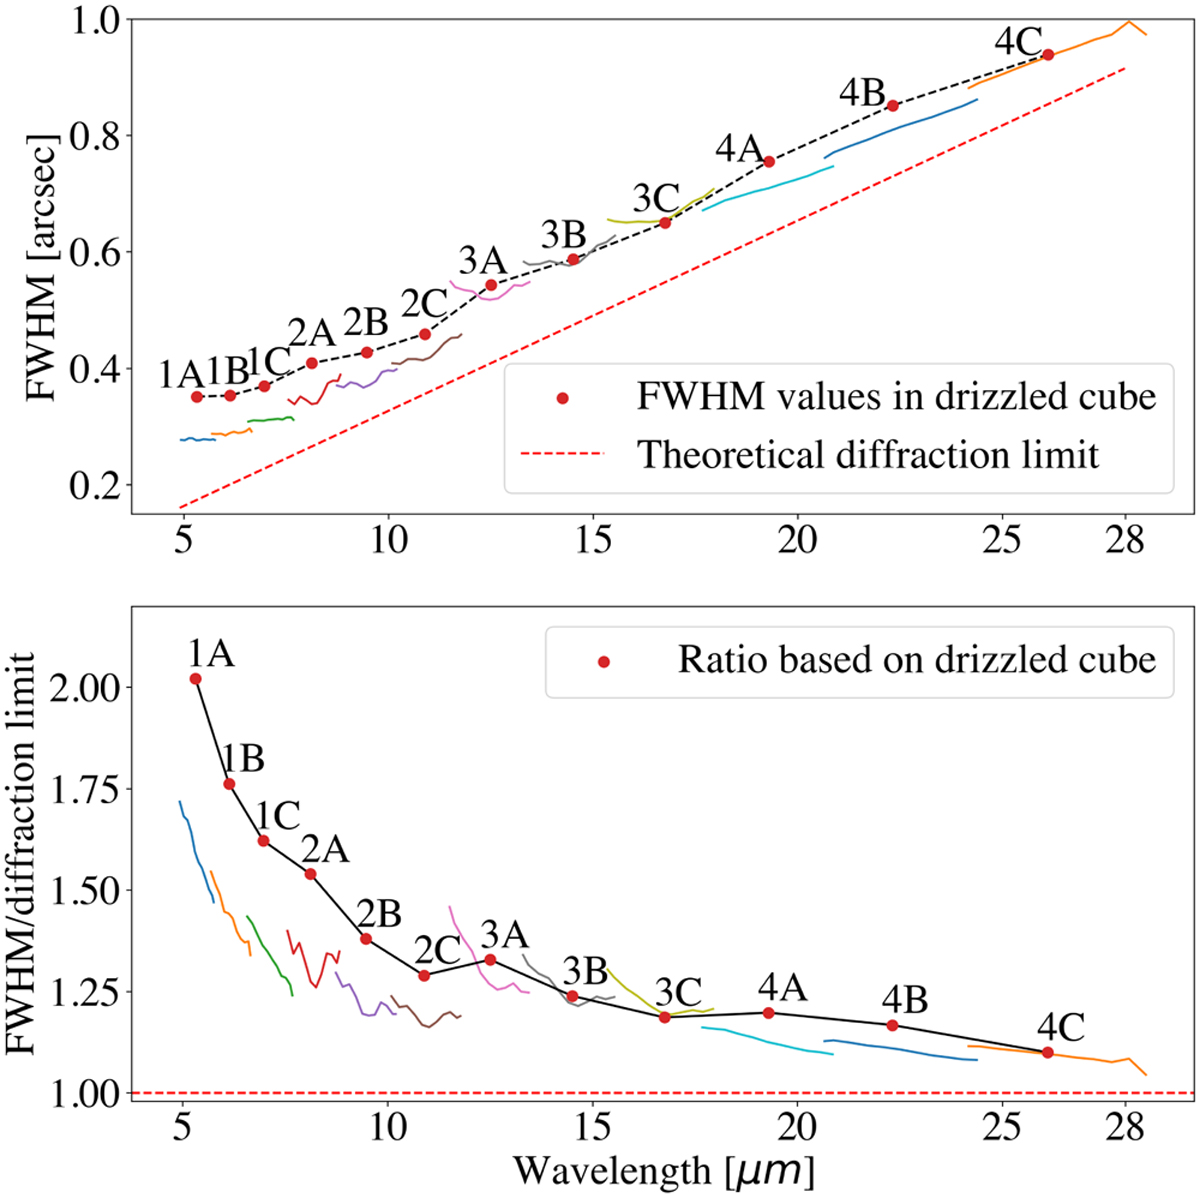
MRS PSF FWHM compared to the diffraction-limited prediction. Top: MRS PSF FWHM determined on the detector image plane for each of the 12 MRS spectral bands (colored curves) as well as in the reconstructed 3D drizzled cubes (black dashed line). The theoretical diffraction limit is shown by the diagonal dashed red line. Bottom: Ratio of computed FWHM on the detector plane (colored curves) and the reconstructed 3D drizzled cubes (black dashed lines), and a diffraction-limited FWHM.
Current usage metrics show cumulative count of Article Views (full-text article views including HTML views, PDF and ePub downloads, according to the available data) and Abstracts Views on Vision4Press platform.
Data correspond to usage on the plateform after 2015. The current usage metrics is available 48-96 hours after online publication and is updated daily on week days.
Initial download of the metrics may take a while.