Fig. 5
Download original image
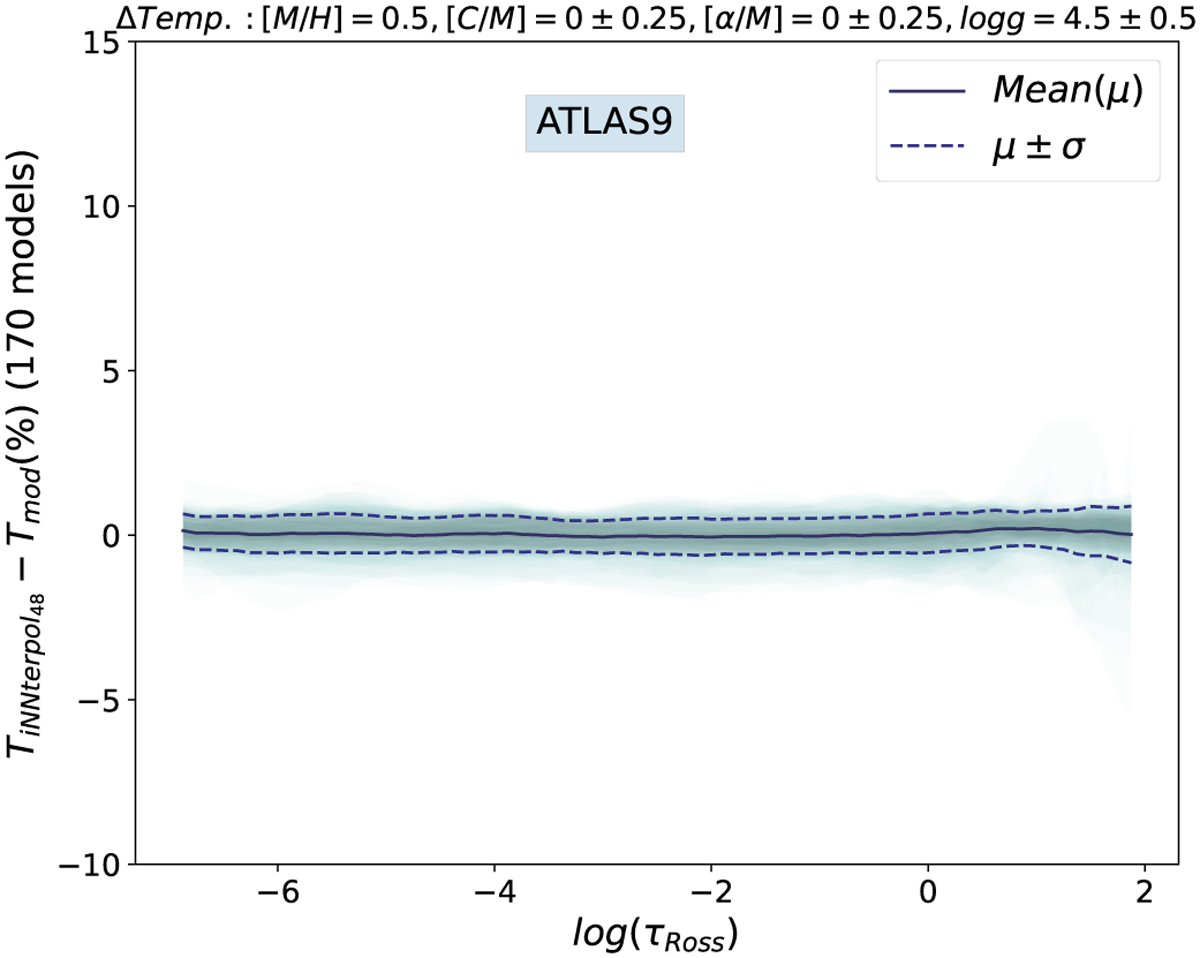
Results for CAE48-NN for ATLAS9 data with a bottleneck of 48 to compare with PCA48-NN (Fig. 2). Differences in temperature as a percentage between the predicted models and the actual ones for points in the grid never seen for the NN. The number of layers chosen were 16 and the number of neurons per layer were 48, instead of 12 layers and 40 neurons per layer we used for PCA. The plot is represented in axis scales so as to compare it with Fig. 2.
Current usage metrics show cumulative count of Article Views (full-text article views including HTML views, PDF and ePub downloads, according to the available data) and Abstracts Views on Vision4Press platform.
Data correspond to usage on the plateform after 2015. The current usage metrics is available 48-96 hours after online publication and is updated daily on week days.
Initial download of the metrics may take a while.