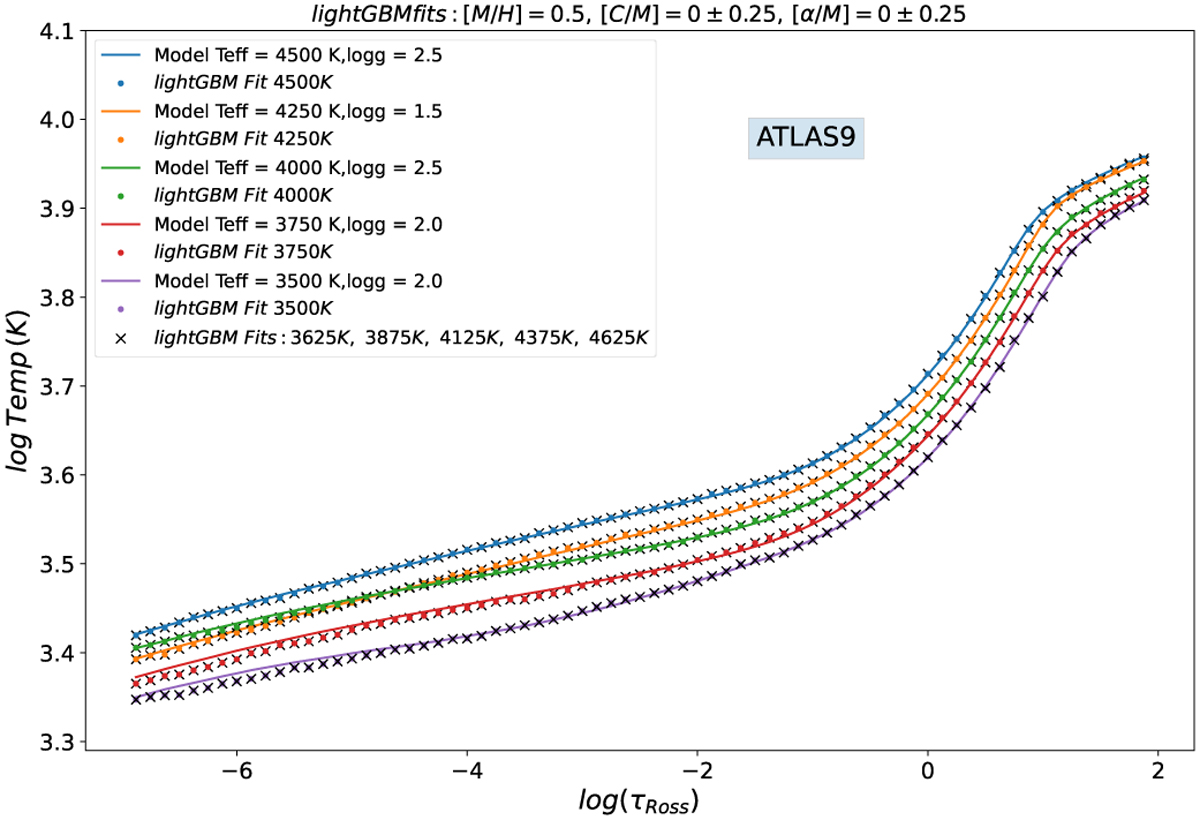
Fig. 3
Download original image
LightGBM fits to model data for test points. Solid lines correspond to actual model data and solid circles illustrate the fit of the LightGBM model to these parameters, predicting the temperature. The crosses show the predictions to the data just adding 125 K to the effective temperature parameter and leaving the rest of the parameters unchanged. We note that the dots and crosses are predicted with the same values.
Current usage metrics show cumulative count of Article Views (full-text article views including HTML views, PDF and ePub downloads, according to the available data) and Abstracts Views on Vision4Press platform.
Data correspond to usage on the plateform after 2015. The current usage metrics is available 48-96 hours after online publication and is updated daily on week days.
Initial download of the metrics may take a while.