Open Access
Fig. 10
Download original image
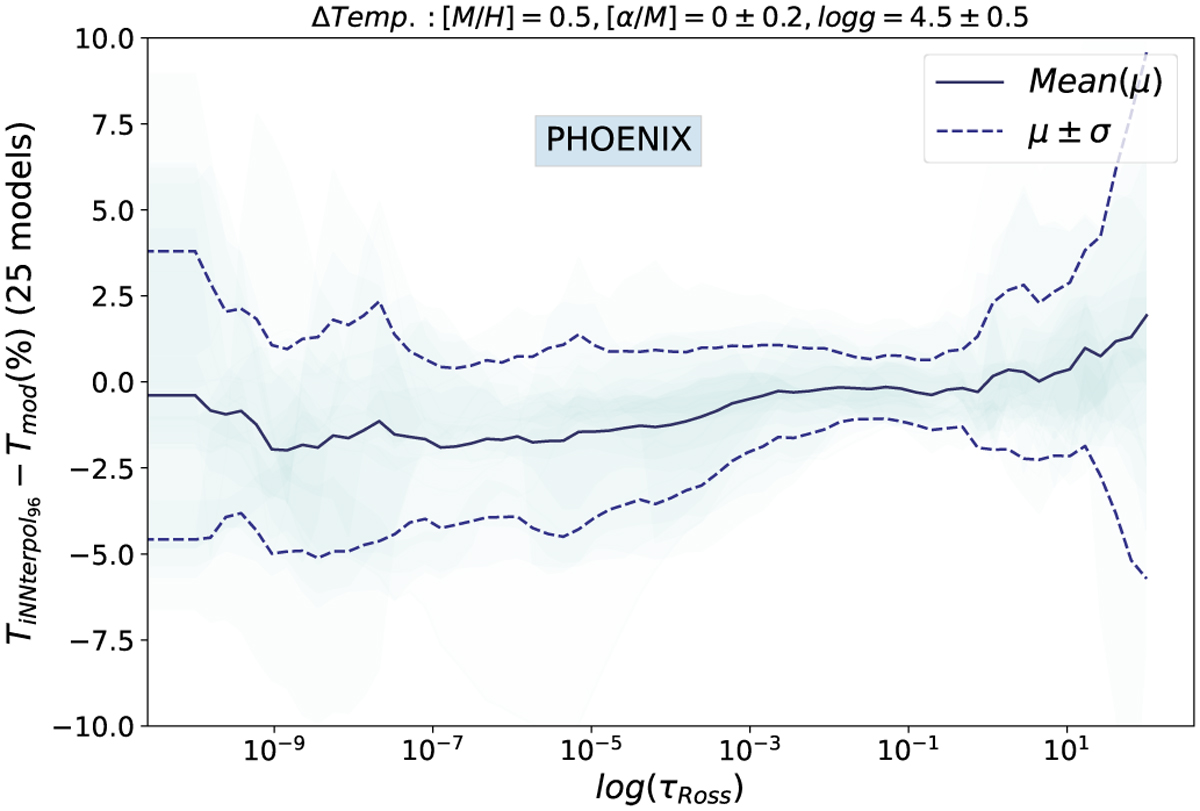
Results of CAE96-NN for PHOENIX data with a bottleneck of 96, 16 layers, and 96 nodes for each layer. Differences in temperature as a percentage between the predicted models and the actual ones for points in the grid never seen for the NN. The full range of effective temperatures are covered (2500 K to 15 000 K).
Current usage metrics show cumulative count of Article Views (full-text article views including HTML views, PDF and ePub downloads, according to the available data) and Abstracts Views on Vision4Press platform.
Data correspond to usage on the plateform after 2015. The current usage metrics is available 48-96 hours after online publication and is updated daily on week days.
Initial download of the metrics may take a while.