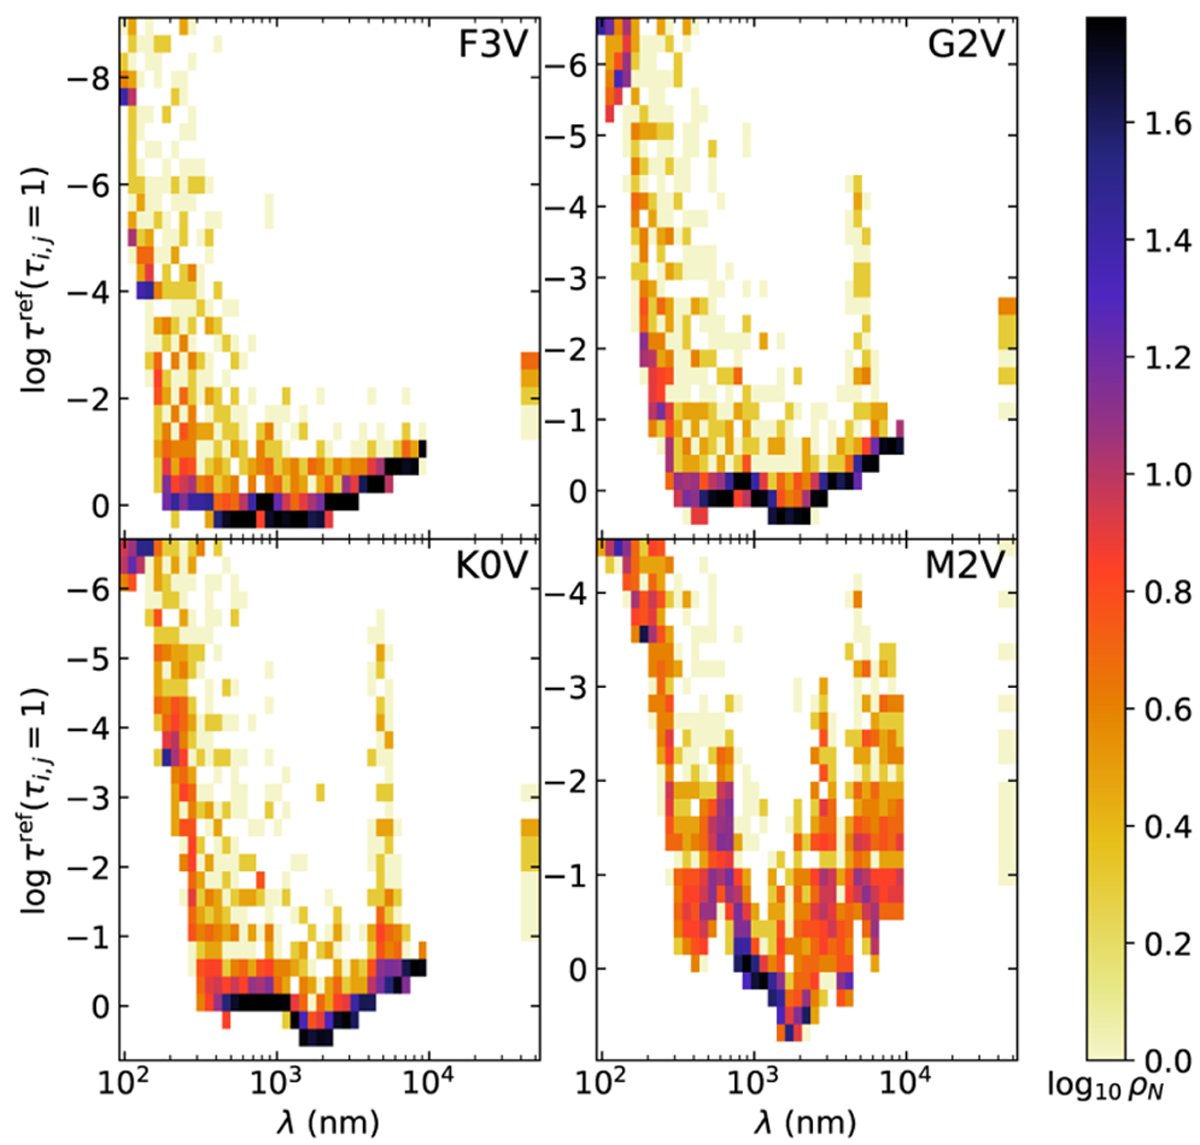
Fig. 9
Download original image
Histogram of the logarithm of the relative number of points from the ODF as a function of τref(zi,j) in the vertical axis and λ in the horizontal, as in Fig. 8. The density of the ODF points is the largest in the continuum (especially in the visible) and in the UV owing to the sampling of the ODF steps (see the description of the ODF tables in Sect. 4).
Current usage metrics show cumulative count of Article Views (full-text article views including HTML views, PDF and ePub downloads, according to the available data) and Abstracts Views on Vision4Press platform.
Data correspond to usage on the plateform after 2015. The current usage metrics is available 48-96 hours after online publication and is updated daily on week days.
Initial download of the metrics may take a while.