Fig. B.2
Download original image
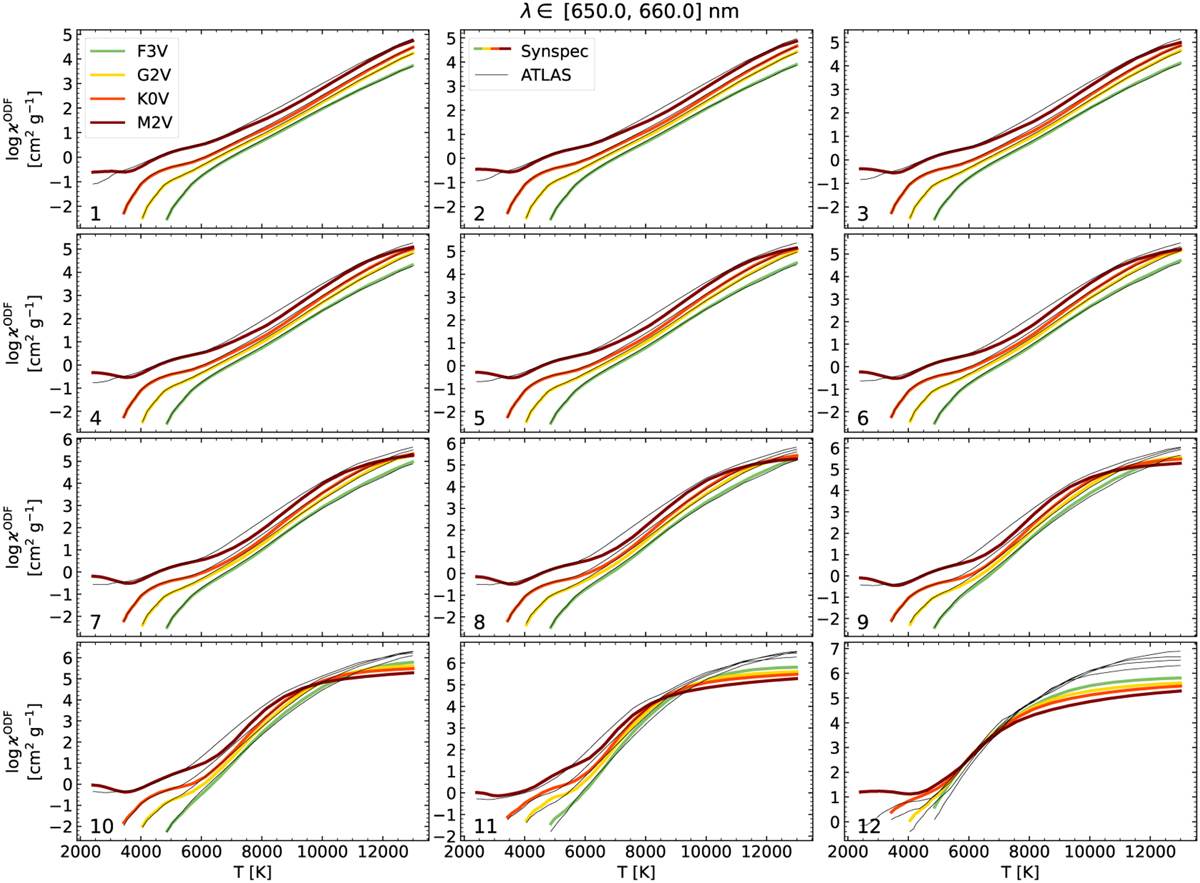
Same as Fig. B.1, but for the step defined by λ ∈ [650, 660] nm containing hydrogen Ha. This example shows that there are significant differences between the two data sets in the strong hydrogen line. The differences are present in all substeps for the M star, but also in the more opaque substeps (rows three and four) for the three hotter stellar types.
Current usage metrics show cumulative count of Article Views (full-text article views including HTML views, PDF and ePub downloads, according to the available data) and Abstracts Views on Vision4Press platform.
Data correspond to usage on the plateform after 2015. The current usage metrics is available 48-96 hours after online publication and is updated daily on week days.
Initial download of the metrics may take a while.