Fig. A.1
Download original image
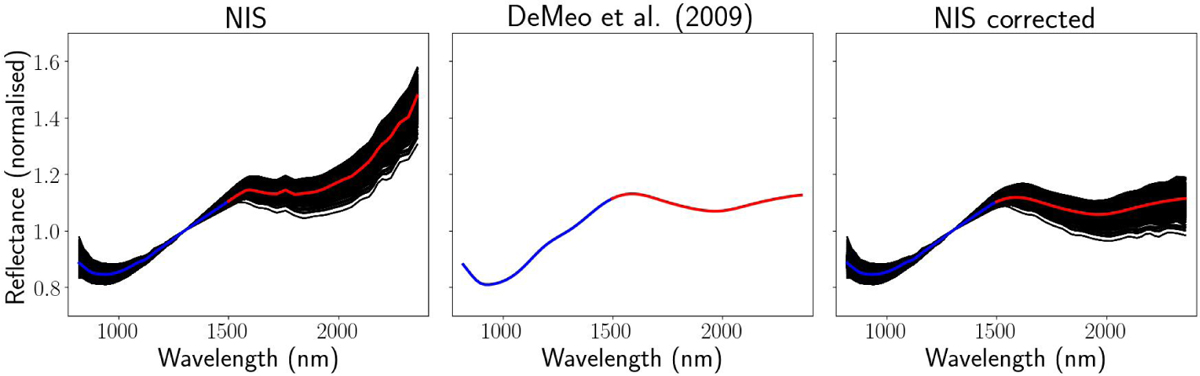
Correction procedure of Eros NIS spectra. Left: NIS Eros spectra used in this study before correction (black) and their mean (blue-red curve). Middle: Ground-based Eros spectrum. Right: Corrected NIS spectra (black) with their mean (blue-red curve). The blue curve corresponds to wavelengths where no correction was applied while the red curve is in the corrected InGaAs spectral part.
Current usage metrics show cumulative count of Article Views (full-text article views including HTML views, PDF and ePub downloads, according to the available data) and Abstracts Views on Vision4Press platform.
Data correspond to usage on the plateform after 2015. The current usage metrics is available 48-96 hours after online publication and is updated daily on week days.
Initial download of the metrics may take a while.