Open Access
Fig. 1
Download original image
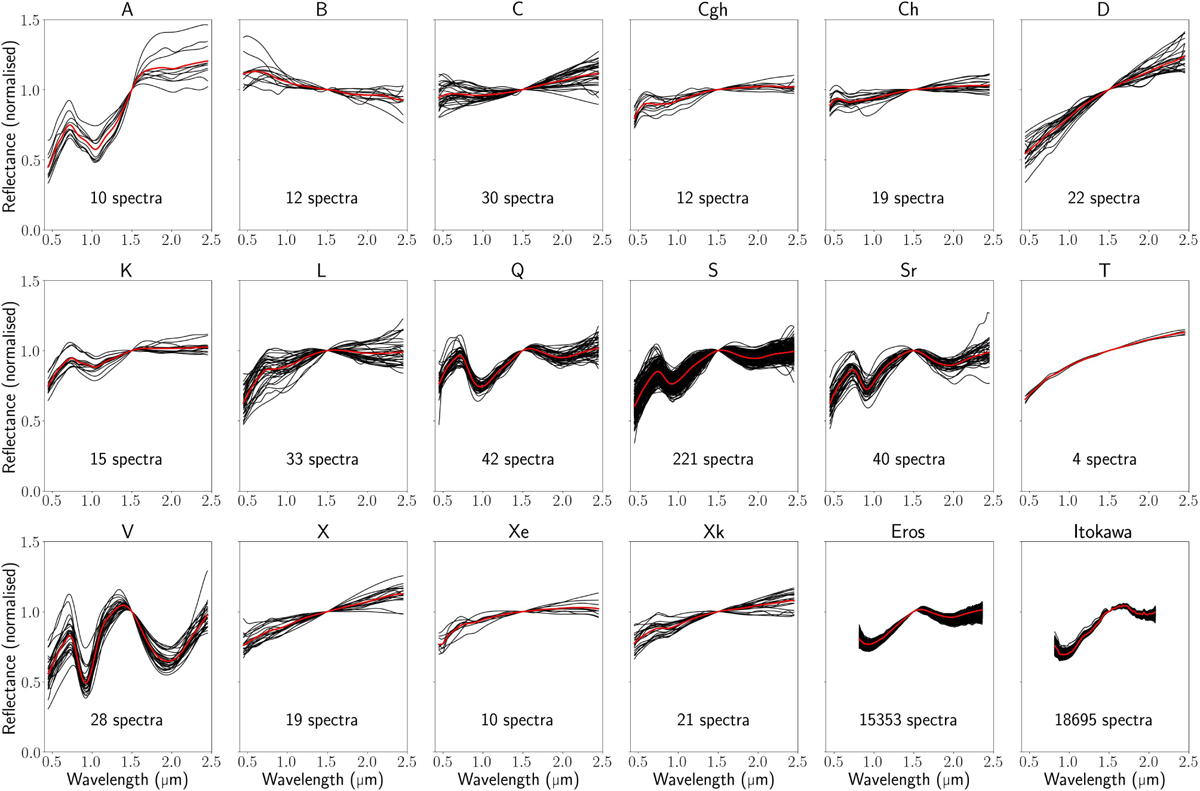
Individual reflectance spectra of the reduced taxonomy classes and of Eros and Itokawa. The thick red spectrum on top of each subplot represents the average spectrum of the type. For visualisation purposes, all spectra were re-normalised at 1500 nm.
Current usage metrics show cumulative count of Article Views (full-text article views including HTML views, PDF and ePub downloads, according to the available data) and Abstracts Views on Vision4Press platform.
Data correspond to usage on the plateform after 2015. The current usage metrics is available 48-96 hours after online publication and is updated daily on week days.
Initial download of the metrics may take a while.