Fig. 5
Download original image
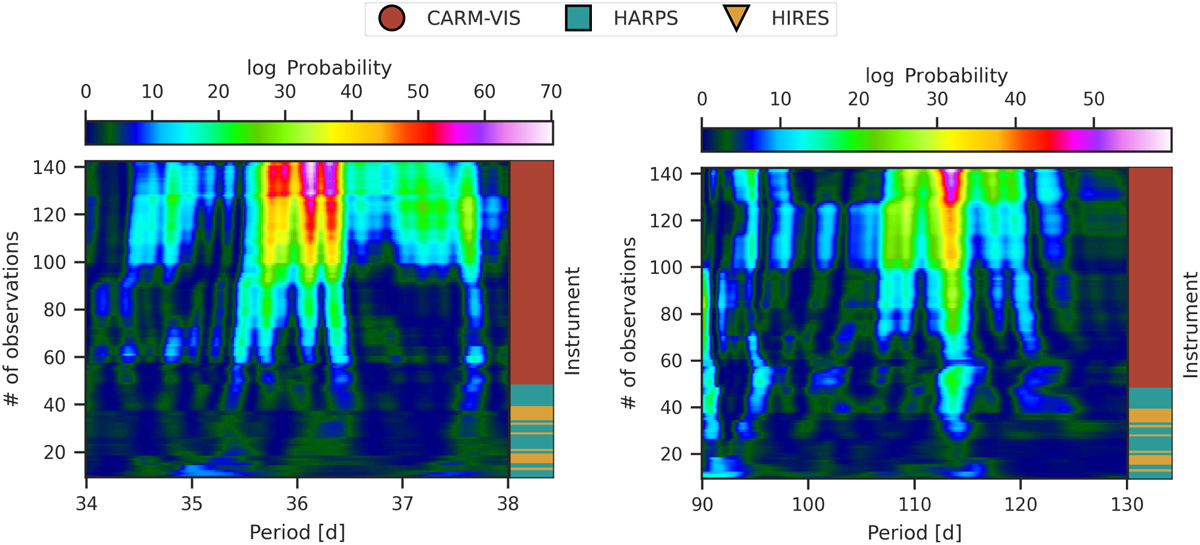
Evolution of the s-BGLS periodogram of the CARMENES, HIRES, and HARPS RV data around 36 d (left) and in the region between 90 d and 130 d (right). The periodograms were generated using the residuals after subtracting the respective other periodicity, namely, the 113-d period in the left panel and the 36-d signal in the right panel. Both s-BGLS periodograms include the stellar rotation period. The colorbar on the top shows the Bayesian probability, where higher values are more likely. The right side of each plot indicates the instrument from which the individual added data points originate.
Current usage metrics show cumulative count of Article Views (full-text article views including HTML views, PDF and ePub downloads, according to the available data) and Abstracts Views on Vision4Press platform.
Data correspond to usage on the plateform after 2015. The current usage metrics is available 48-96 hours after online publication and is updated daily on week days.
Initial download of the metrics may take a while.