Fig. 4
Download original image
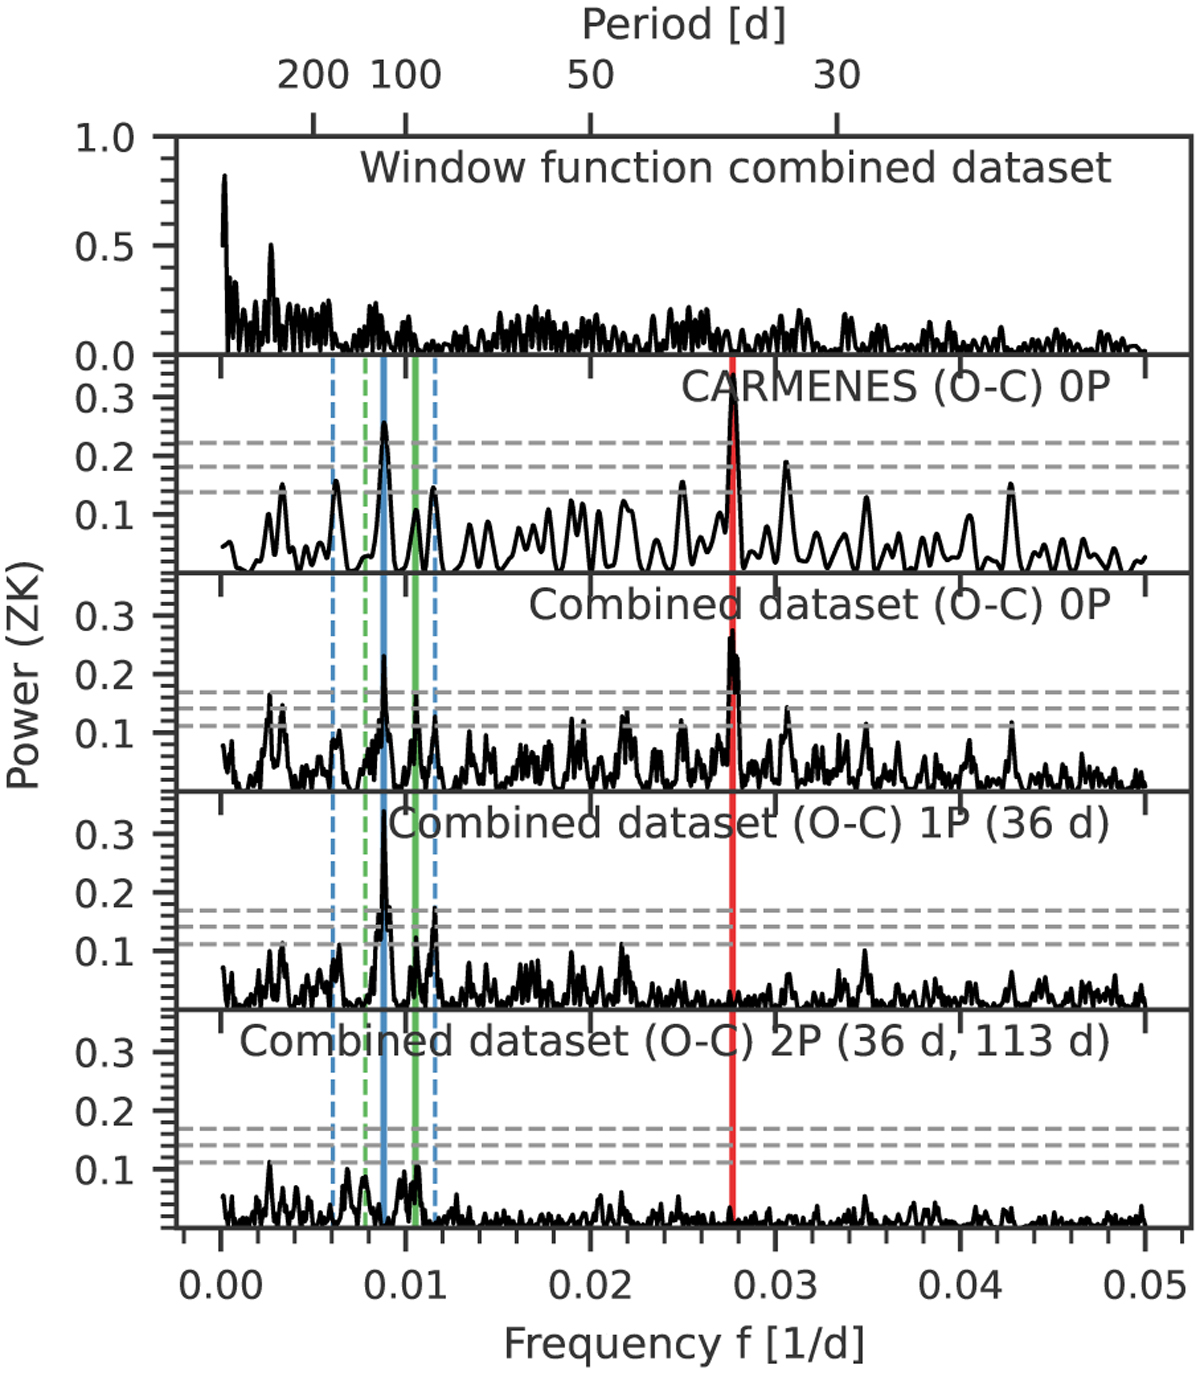
Signal search with GLS periodograms in the RV data of HN Lib. The first panel shows the window function of the combined CARMENES, HIRES, and HARPS dataset. In the second panel, we show the GLS of only the CARMENES data. The subsequent panels present the GLS periodograms of the combined data. Each panel shows the residuals after subtracting models of increasing complexity. Inset texts describe the type of model that was applied to the data before the GLS was generated. A red solid line marks the period of the 36-day signal and the blue line shows the 113-day signal, while the green line denotes the rotation period of HN Lib. The 365 d alias frequencies of the 113-day signal and the stellar rotation period are highlighted by dashed lines. FAPs of 10, 1, and 0.1% were calculated, using the analytical expression of Zechmeister & Kürster (2009) and are shown by the horizontal gray dashed lines.
Current usage metrics show cumulative count of Article Views (full-text article views including HTML views, PDF and ePub downloads, according to the available data) and Abstracts Views on Vision4Press platform.
Data correspond to usage on the plateform after 2015. The current usage metrics is available 48-96 hours after online publication and is updated daily on week days.
Initial download of the metrics may take a while.