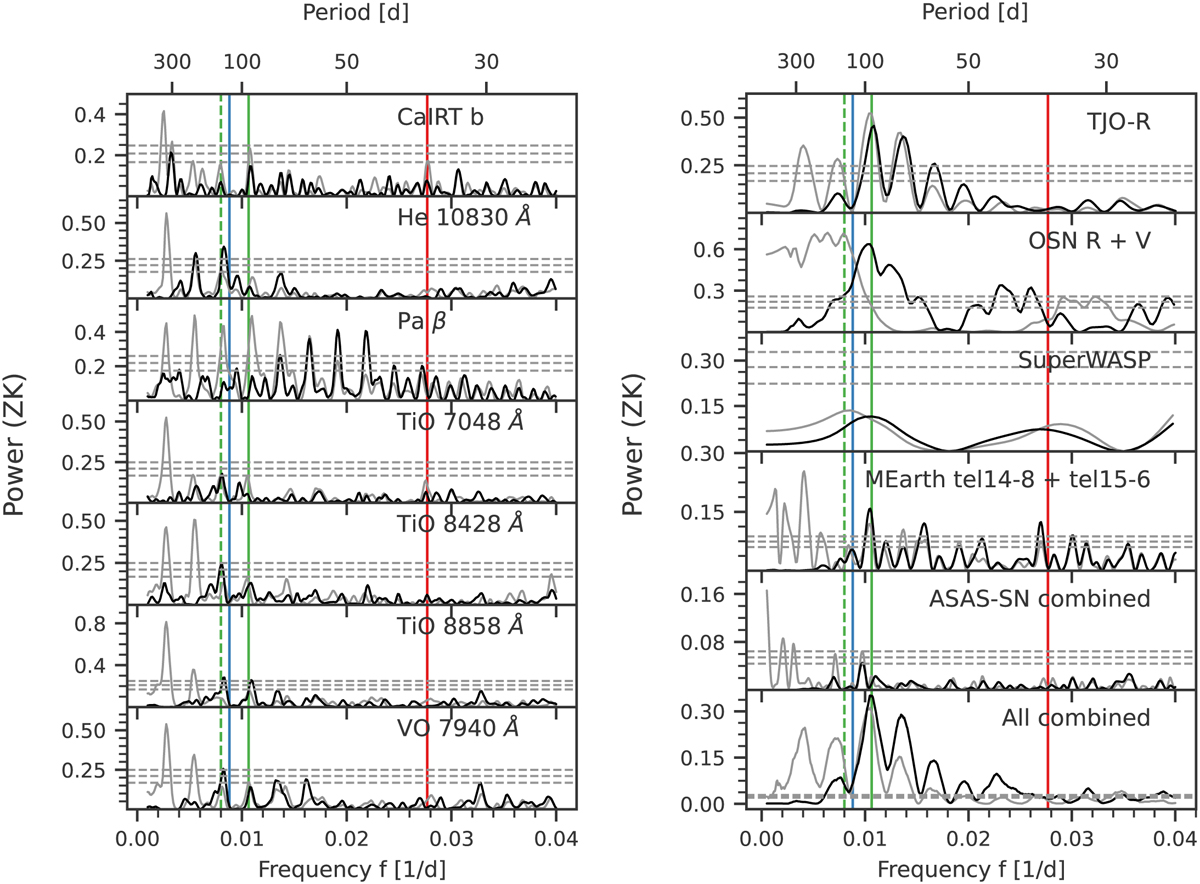
Fig. 2
Download original image
Signal search with GLS periodograms in the spectral activity indicators (left) and photometric data (right) of HN Lib. The data of the activity indicators were pre-whitened by subtracting the long-period ~360 d or ~180 d signals accordingly, whereas the photometric data were detrended using CAFM to remove the appearing long-term trends. Original periodograms are shown in grey and the corrected ones in black. We mark the 36-day signal from the RVs with a red solid line and the 113-day period with a blue solid line. The common alias pair of the activity indicators with periods of ~125 d and ~94 d are depicted by green dashed and solid lines, respectively. FAPs of 10, 1, and 0.1% were calculated with the analytical expression of Zechmeister & Kürster (2009) and are shown with the horizontal grey dashed lines from bottom to top.
Current usage metrics show cumulative count of Article Views (full-text article views including HTML views, PDF and ePub downloads, according to the available data) and Abstracts Views on Vision4Press platform.
Data correspond to usage on the plateform after 2015. The current usage metrics is available 48-96 hours after online publication and is updated daily on week days.
Initial download of the metrics may take a while.